Getting started
What is TalentUp
TalentUp is a salary-benchmarking platform built for HR, Compensation, and Benefits teams. It exists to answer the question every people team eventually runs into: is what we pay competitive, fair, and defensible, and how do we actually know that instead of guessing?
How it works
At its core, the platform brings together two things: real market salary data, compiled from compensation reported across many companies, positions, and locations, and your own company's employee data, imported from a spreadsheet or synced from an HRIS. Neither one on its own answers the question. Market data alone tells you what the market pays; your own payroll data alone tells you what you pay. Only by combining them can TalentUp show you how the two compare, role by role and person by person, and flag where they drift apart.
Two sides of one platform
The internal facing side of the platform, including Employees, Insights, Grading, Salary Bands, and Job Level Evaluation, turns that same market data into a working compensation structure for your own company: a leveling framework every role is graded against, salary bands built from that framework, and a live view of where each employee sits relative to those bands, their compa-ratio, and any pay equity risk that needs attention.
The market facing side of the platform, including Search Salaries, Compare Salaries, Company Finder, and Benchmark Comparison, is where you look up competitive pay before making an offer, opening a role, or planning next year's compensation budget. Results are broken down into percentiles (P10 through P90) by seniority level, location, sector, and company type, and can be converted between gross, net, company cost, and contractor pay.
Both sides share one account and one plan (Free, Pro, or Premium, see Plans and credits below), so a market check, a hiring decision, and a pay equity review can all be done from the same underlying data, instead of juggling numbers exported into spreadsheets that quietly drift out of sync with each other.
Built with compliance in mind
TalentUp is also built with compliance in mind. The EU Pay Transparency Directive (Directive (EU) 2023/970) requires employers across the European Union to disclose pay information, report on gender pay gaps, and justify pay differences between employees doing equal work or work of equal value. Insights already surfaces the gender pay gap and pay equity metrics that this kind of reporting depends on, and Salary Bands gives you the documented structure that regulators and employees alike will expect to see. For country by country legal status, deadlines, and obligations, TalentUp also maintains a dedicated Pay Transparency Hub.
What this means for your team
In practice, that means TalentUp can help HR, Compensation, and Benefits professionals in very concrete ways: setting a competitive, market backed offer before losing a candidate to a counteroffer, running an annual compensation review without exporting data into a dozen spreadsheets, catching pay equity risks (such as two people doing the same job for meaningfully different pay) before they become a legal or reputational problem, and building salary bands and a leveling framework that survive an audit or an employee question, because every number can be traced back to real market data.
Every number you see in the app is explained in this documentation, organized the same way as the left-hand menu, so you can look things up while you work: a market percentile, a compa-ratio, a band status.
TalentUp Coverage
Before you search, it helps to know how broad TalentUp's underlying data actually is. Coverage grows every day as new sources are added and TalentUp's own users contribute data, so treat these as a live snapshot of what TalentUp currently covers, not a fixed ceiling.
- Roles: close to 800 distinct, benchmarkable positions, each with its own description. Browse the full list, grouped by department, on the Job Catalog page.
- Countries: salary data across 98 countries.
- Cities: coverage reaches over 38,000 cities, so results can usually be narrowed down to the exact city a role is based in rather than just a country or region.
- Departments: every role is organized into one of 22 departments, from Engineering and Sales to Finance and Human Resources, the same grouping used on the Job Catalog page.
- Companies: data draws on more than 5 million companies, from early-stage startups to large multinationals.
Methodology and Data Science
Understanding how TalentUp's data is built helps you use it with confidence. This section explains where the salary data comes from, how it's processed, and what the Confidence Ratio means when you're reading a benchmark result.
Where the data comes from
TalentUp collects compensation data from three complementary sources, giving the platform a broad and representative view of the job market:
- 72% Job boards: the majority of TalentUp's data comes from hundreds of public job portals, scraped daily to capture job descriptions, salary offers, location, benefits, and company metadata. This provides a real time pulse on what companies are actively offering in the market.
- 17% Employee submitted profiles on TalentUp.io: employees voluntarily submit their compensation details through the TalentUp platform. Each submission is validated by comparing it against similar roles, companies, and locations to ensure accuracy and relevance.
- 11% HR datasets from client companies: TalentUp clients can upload anonymized internal compensation data via Excel templates or HRIS integrations. This data is included only if it was collected in the current year, keeping the dataset fresh and reliable.
The four step data process
Every data point goes through a four step pipeline before it's used in a benchmark: Collection, Normalization, Deduplication, and Validation.
1. Collection. TalentUp collects over 20,000 new salary data points per day from 300+ sources across 98 countries and close to 800 job roles. Beyond salaries, the platform captures bonuses, job descriptions, company information, and benefits, giving each benchmark richer context.
2. Normalization. Raw data from different geographies and sources is standardized so it can be compared meaningfully, across three areas:
- Currency conversion: salaries from international sources are converted using daily exchange rates.
- Job title translation: TalentUp's taxonomy maps over 32,000 roles across multiple languages, so the same position is interpreted consistently regardless of how it was titled in the source.
- Benefit standardization: common benefits such as health insurance, remote work, and stock options are normalized even when described differently across sources.
This makes it possible to compare a Software Engineer in São Paulo with the same role in Berlin or Toronto on a like for like basis.
3. Deduplication. Duplicate listings and repeated job offers are filtered out using natural language processing (NLP) algorithms that detect semantic similarities in job descriptions and employer metadata, so every data point is unique and the final benchmark isn't inflated or skewed.
4. Validation. Both automated checks and manual reviews are applied before a benchmark is published:
- Benchmark comparison: a sudden change in a benchmark, for example a 20% salary increase for a single city-role combination, triggers an automatic flag for further review.
- Sample size threshold: a minimum of 30 data points per benchmark is required before it is published, to keep it statistically reliable.
- Manual cross-check: significant deviations from historical benchmarks or industry standards are reviewed manually and cross-verified with partner sources.
All benchmarks are refreshed every one to two months, so the data you see reflects current market conditions.
Predictive modeling
For roles, locations, or seniority levels where collected data is sparse, TalentUp uses predictive analytics to fill gaps and maintain continuous coverage without sacrificing reliability.
- Linear regression models: salary trends are estimated based on seniority and experience using regression models tuned to reflect realistic career compensation growth.
- Correlation across similar markets: when direct data isn't available for a given city, TalentUp estimates benchmarks by drawing on correlations with similar locations, industries, or company sizes, keeping coverage reliable even in less data rich regions.
- Data completion: predictive modeling lets TalentUp provide complete salary ranges, from base pay to bonuses, even when only partial source data exists, for a consistent experience across every role and location.
How filters and sample size work
Every benchmark is built to rest on a reliable sample. When your filters (sector, company size, funding, keywords), or a new or niche position or location, leave fewer than 30 matching data points, TalentUp doesn't publish a thin number. Instead, it broadens the reference group with comparable roles and similar or nearby markets and, where needed, relaxes the least decisive filters, until the sample is robust.
Under the pay table, Nº of observations shows how many observations match your filters, with the total for your search in parentheses, for example 312 (1,240 total). When the matching group is small, or the position itself is new, the number is followed by includes comparable data, and the Details button shows how the number is built. When you search by category, department or location, the number counts the observations across the roles it covers. A small matching group doesn't make a benchmark less reliable: it means the benchmark is complemented to meet our minimum sample standard.
When you combine several company filters, for example a sector and a company size, the benchmark combines the market data for each of them: companies in that sector and companies of that size. Nº of observations counts only the observations that match all of your filters at once, so it describes a narrower group than the data behind the benchmark and is usually the smaller number.
Benchmark participants lists the companies whose employees contributed to the benchmark. Its header shows how many companies and observations are behind your search, the same number you see under the pay table, so the two always agree. When the matching group is small, a short note explains that the benchmark is complemented with comparable data, and Download CSV exports the list. If there is little employee data for your search, the list may show companies that have posted job ads for the role instead, and the number of companies is then not shown.
Confidence Ratio
Every benchmark on Search Salaries and Company Finder shows a Confidence badge next to the market compensation, rated Fair, Good, or Excellent. The badge reflects TalentUp's Confidence Ratio, which tells you how reliable that specific data point is, calculated from three factors: sample size (how many data points underlie the benchmark), distribution quality (how consistent the reported salaries are with each other), and data freshness (how recently the data was collected).
Use this badge to calibrate how much weight to put on a benchmark when making compensation decisions:
- Excellent: highly reliable; use with confidence for formal decisions such as salary bands or offer setting.
- Good: solid and trustworthy; suitable for most benchmarking purposes.
- Fair: useful as a directional guide, but treat with some caution and consider supplementing with additional context.
Plans and credits
TalentUp offers three plans: Free, Pro, and Premium. Each one raises the ceiling on how many positions you can unlock, how many employees you can manage, and which features (Peer Groups, custom grading, Job Level Evaluation) are switched on. Your current plan and available credits are always shown on the Dashboard.
- Free: one seat, one full benchmark unlock for life, and search limited to a single position at a time. Manage up to 10 employees and run the Pay Transparency Compliance Tool for up to 10 employees, so a small team can get real value before paying anything.
- Pro: €60/month, billed monthly, cancellable anytime. Includes 1 credit every month, plus up to 1,500 more credits you can buy whenever you need them. Raises the employee ceiling to 25 for both benchmarking and the Pay Transparency Compliance Tool, unlocks competitor analysis and benchmark data from other grading providers such as Korn Ferry, Mercer, Radford, and WTW, and is the first plan that can build a personalized grading framework of its own.
- Premium: TalentUp's custom, sales assisted plan for larger organizations. Unlimited seats, full benchmarks, and employees, with search by position, category, department, or location instead of position alone. Unlocks Peer Groups, Job Level Evaluation, and priority support on top of everything Pro includes. Pricing is tailored to your company, so getting on Premium means talking to the TalentUp team rather than checking out online.
A credit is what unlocks one full benchmark: a specific position and location combination, with every seniority level and percentile fully visible instead of blurred. Using a credit unlocks that search for one year from the moment you spend it; after that year it locks again unless you spend another credit on it. Credits you haven't used yet, and the benchmarks you've already unlocked, are both listed on the Dashboard so you always know what you have left and what you already paid for.
Company
Dashboard
The Dashboard is your account and your company's shared benchmarking hub. Everyone on your team who logs in sees the same Dashboard, tied to your company rather than to any one person, so credits, unlocked benchmarks, and saved searches are shared across the whole team instead of being siloed per user.
If you're on the Free or Pro plan, three cards sit at the top. Credits Available shows how many credits you have left and lets you jump straight to Search Salaries or buy more. Employee Positions Available shows how many of your employee slots are used, for example 8/25, and lets you add an employee or connect an HRIS integration. A third card nudges you toward upgrading, with copy that adapts to your plan. Premium companies have unlimited everything, so these three cards don't show at all, the page goes straight to Company settings.
Company settings holds two cards you can click to open a settings panel. Fixed Filters lets you set a default sector, company type, employee count range, funding range, revenue range, up to 5 keywords, and, on Premium, a default Peer Group, all applied automatically to both your employee data and your benchmark searches. Salary View lets you set the default pay frequency (yearly, monthly, weekly, daily, or hourly) and compensation type (gross, net, company cost, or contractor) everyone on your team sees by default. Grading is no longer set here: it now has its own dedicated Grading page in the left menu.
Below that sits your company's shared space: four tabs your whole team works from together.
- Members: your team roster, with each person's name, position, department, location, and role (Owner, Admin, or Manager). Owners and Admins can invite new teammates by email and assign them a role; inviting a Manager also lets you assign which employees they're responsible for, either individually or through a saved rule.
- Unlocked Benchmarks: every position and location search your team has spent a credit on, with who unlocked it, the filters that were applied, and its expiration date. An unlocked benchmark can be reopened any time before it expires with View, or shared with a teammate via Share; once it expires, reopening it costs another credit.
- Saved Benchmarks: searches your team bookmarked from the results page for later, whether or not they were ever unlocked. Each one can be reopened, shared, or removed, and rerunning a saved search with different filters asks whether to update it or save it as a new benchmark.
- Downloads: the status of every Excel report your team has requested, moving from Pending to Processing to Ready as it's generated in the background. A finished report can be downloaded or deleted; if one fails, a Try again button retries it.
Example
These three cards only show on the Free and Pro plans; Premium skips straight to Company settings.
Internal Pay Analysis
My Compensation
My Compensation is a personal, company-internal pay page for one specific employee: their own total compensation, their own career path within the company, and how their pay compares to colleagues at their own level, all drawn from the same employee data you manage on Employees. It's deliberately different from every other page in this section: there's no market percentile, no external benchmark, and no compa-ratio here, only how that person's pay compares inside your own company.
There are two ways into the same page. An employee who's been granted their own login sees their own My Compensation, and only their own, every time they sign in. A company user (Owner, Admin, Manager, Member, or Team member) sees it too, but as a preview: the first visit asks which employee record is theirs, or it can be opened for any employee directly from that person's profile on Employees, with a Grant Access button that invites them to create their own login and start seeing this page themselves.
Reading the page
- The header card shows the employee's name, position, level badge, and location, with a collapsible panel underneath for their Job Description and Level Description.
- Annual total compensation is one headline number, broken into a stacked bar of base salary, bonus, and, when they apply, variable pay and benefits, each labeled underneath with its own amount.
- Career path within [company] is a timeline built from the employee's own work history: when they joined, every promotion (shown as an old level → new level badge), and every salary increase, newest first.
- Gender gap in [company] and Gender gap in your level are two donut charts showing the male/female split company-wide and among only the employee's own-level colleagues.
- Pay gap in your level compares the mean pay of male and female employees at that same level as two bars, with a red segment marking exactly how far the employee's own salary sits from the mean of their own gender at their level.
A Download PDF button turns the whole page into a compensation statement the employee can keep. In preview mode, a company user also sees a Back to employees link next to it; a company user viewing their own self-selected page instead sees a small Is this not you? link to clear that selection and pick a different employee record.
For a contractor, the page looks different. A notice at the top explains that My Compensation isn't available for contractors, the compensation card shows their Hourly rate instead of Annual total compensation, there is no Pay gap in your level card and no Download PDF button, and amounts in the career path carry /h.
Granting an employee their own login is different from adding them to your team: it creates a separate account, with the employee role rather than Owner, Admin, Manager, or Member, that only ever shows this one page, so the employee can check their own pay themselves without being given access to anything else in TalentUp.
Example
Annual total compensation
€58,400
12 pays | Full-time (40 hours per week)
Base salary €37,400
Bonus €10,500
Variable pay €5,800
Benefits €4,700
Career path within Acme Technologies
15/03/2026
Promoted Mid Professional → Senior Professional
02/06/2022
Hired as Product Designer
Gender gap in Acme Technologies
Male 43%
18 Employees
Female 57%
24 Employees
Gender gap in your level
Male 60%
3 Employees
Female 40%
2 Employees
Pay gap in your level
Mean Male Pay €54,800 Yearly
Mean Female Pay €48,200 Yearly
Gap in your salary €6,600 Yearly
Employees
The Employees page is your company's benchmarking roster: every employee you've added, each one compared automatically against market data for their position, location, and level. It's the only page that shows an employee's full market salary range alongside their actual pay, so you can see at a glance where they sit.
Reading the table
- Employee: name and position, with an avatar.
- Level: their seniority, shown as a colored pill from your active grading.
- Location: city and country.
- Base Salary: their salary, with the market-position badge shown directly underneath it: Below market, In market, Above market, or Benchmark unavailable (see Reading band status under Key concepts).
- Labels: employment status (Active, Below-market pay, or Dismissed), plus Access Granted, Missing data, and Unequal pay flags whenever they apply.
- Actions: Unlock (spends a credit) if that position and location aren't unlocked yet, or View benchmark once they are.
Filtering the table
The filter panel on the left narrows the table by Name or ID, Position, Entity, Department, Location, Level, Gender, a Salary range slider, Worker type, and Label. Worker type only appears once you have at least one contractor. Label is the useful one for cleanup work: it isolates exactly the employees flagged with Below-market pay, Unequal pay, Gender gap, Bonus gap, or Missing data, so you can work through one risk category at a time instead of scanning the whole table.
Gender always offers the same four options, Male, Female, Other, and Unspecified, whether or not anyone on your roster falls into each group. Unspecified catches everyone whose gender was never filled in, so it stays separate from Other: filtering by Other shows the people recorded that way, not the gaps in your data. The same Gender filter is on Insights, where it narrows every chart on the page to one group.
At the bottom of the panel, Save as list turns the filters you're looking at into a saved list, so you don't have to rebuild them next time (see Lists below).
Entities, locations and pay transparency rules
Next to Bulk actions there is a selector for the entity or location you're working on. If any employee has an Entity filled in, the selector lists your entities, each with the country where most of its people work, for example Northwind Iberia SL (Spain); otherwise it lists one option per country your employees work in. The same selector sits on Insights, next to Generate report and Adjust Criteria, and it remembers your last choice on both pages.
- More than one entity or location: the selector is always shown, with All entities (or All locations) at the top, even when none of them is in the EU. Picking an entity filters the page to it and stays in step with the Entity chips in the filter panel.
- A single entity or location in the EU: there is nothing to choose between, so its name is shown as plain text with the info button next to it.
- A single entity or location outside the EU: nothing is shown at all, since there is nothing to filter and no EU rules apply.
The info button appears whenever the selected scope includes an EU country, and opens a summary of that country's pay transparency rules under the EU Pay Transparency Directive: whether a country-specific law is in force (fully or partly) or the EU Directive default applies, the Reporting threshold (the headcount from which gender pay gap reporting is mandatory), the Pay gap threshold that triggers a joint pay assessment, and how long you have to answer an employee's request for pay information.
The country is always taken from where the employees actually work, never from where the entity is legally registered: a Spanish company whose team all works in Portugal sees Portugal's rules. When the employees are spread over several countries, the modal lists every EU country with its own rules and the number of employees in it, and explains that calculations use the rules of the country where most of them work (on a tie, the country your TalentUp account is registered in). With All entities selected, the title becomes Multiple countries; with one entity selected, the title stays the entity's name. In both cases Know more takes you to the pay transparency hub, which covers every country; when only one country is involved, it opens that country's own page instead. Countries outside the EU are left out of the modal, since the Directive doesn't apply to them.
Example
Pay transparency
Multiple countries
Employees are split across Spain, Italy. Calculations use the rules of Spain, where most employees are.
Spain34 employees
- Reporting threshold
- 100+ employees
- Pay gap threshold
- 5%
- Right to request pay info
- Response within 2 months
Italy12 employees
- Reporting threshold
- 100+ employees
- Pay gap threshold
- 5%
- Right to request pay info
- Response within 2 months
EU Directive 2023/970
This is a summary, not legal advice. Confirm with legal counsel before compliance decisions.
The modal is a summary to help you act, not legal advice: it says so at the bottom, and it's worth confirming with legal counsel before any compliance decision.
Adding employees
- Add employee opens a 3-step form: identity and department in step one, position, level, salary, and benefits in step two, and previous experience in step three.
- Import employees, under Bulk actions, adds many employees at once from an Excel template, with a review page before anything is saved (see Importing employees from Excel below).
- Connect your HR system, inside the same Import window, syncs employees from your HRIS automatically instead of uploading them by hand: Personio, HiBob and AlexisHR connect directly, while BambooHR and Workday can be requested and the TalentUp team helps you set them up.
Importing employees from Excel
Open Bulk actions and choose Import employees. The window walks you through three steps: Download the template, Fill it in, and Upload the file. The template has three tabs: Start here with the instructions and your level system, Employees where you write one row per person, and Reference with the levels, departments, and countries you can use.
- Required columns, marked with an asterisk: Name, Position, Country, Salary, and Currency. Everything else is optional, but the more you add, the richer the analysis: Level, City, Worker type, Gender, Join date, Entity, Department, Experience (years), Bonus, Stock, Benefits, and Variable pay. Gender is what the gender pay gap analysis on Insights is built from.
- Positions are checked against the TalentUp catalog. Write each position the way your company calls it: TalentUp keeps your name and matches it to the closest market position, showing Matched to on the review page when the two differ. A position it can't match becomes an error with a Did you mean suggestion and a link to See available positions.
- Countries are recognized in any common form: English names, names in other languages (España), and ISO codes (ES) all resolve to the same country. An empty country is an error; a country TalentUp doesn't cover is kept as you typed it, but it may have no market data to compare against.
- Contractors: set Worker type to Contractor and write their hourly rate in Salary (for example 45.50); decimals are kept. Leave Worker type empty for employees.
- Levels come from the level system chosen in the Start here tab. On Premium you can pick any grading, including your personalized levels; on other plans employees are placed in TalentUp Seniority.
After the upload, TalentUp reads the file in the background and lets you know when it's ready to review. The Review your import before applying page splits the rows into To add, Already exist (rows with the same name, position, and entity as someone you already have, ignored unless you tick them), and Errors, with a link to redownload your file with the problems marked so you can fix them in Excel. Nothing is saved until you click Import; rows with errors are skipped, and your plan's employee limit applies.
Example
Import
Download the template
An Excel file with the columns we need.
Download templateFill it in
- •One row per employee. Position, country, salary and currency are required.
- •Write the position as your company uses it. We keep that name and show the closest market position. See available positions
Upload the file
We let you know when it is ready to review. Nothing is saved until you confirm.
Connect your HR system
ConnectReview your import before applying
Double-check everything below before it's saved to your account.
24
To add
2
Already exist
1
Errors
| Row | Employee | Position | Salary |
|---|---|---|---|
| 4 | Priya Shah | Dev Backend Matched to "Backend Engineer" |
52000 EUR |
| 5 | Lucía Ortega | Backend Engineer | 62.5 EUR /h |
| Row | Employee | Error |
|---|---|---|
| 9 | Marcus Klein | Position "Data Analyts" is not in our catalog. Did you mean "Data Analyst"? |
Employees and contractors
Not everyone you pay is on payroll. Each person on the roster has a Worker type, Employee or Contractor, and it changes what their salary means: an employee's salary is an annual amount compared with market salaries, while a contractor's is an hourly rate compared with the market contractor rate for the same position, location, and level (the annual market salary × 2 ÷ 2,080). Everyone is an Employee unless you change it, so a roster without contractors looks and works exactly as before.
- In the Add employee and Edit forms, set Worker type to Contractor in step two. The Salary field turns into Hourly rate with a /h suffix and keeps decimals (62,50 stays 62,50), and Number of Pays, Bonus, and Stock disappear because they don't apply to a contractor; whatever they held is discarded on save.
- In the table, a contractor carries a small gray Contractor badge next to their name, and their Base Salary reads as an hourly amount with /h. The market-position badge underneath (Below market, In market, Above market) is calculated against the contractor bands, so it's just as meaningful as an employee's. When a contractor has no rate recorded, the market range shown in its place is hourly too.
- In the profile, the headline reads Hourly rate instead of Annual total compensation, with /h after the amount and a Contractor chip where the number of pays would be. Market position and Percentile are the contractor's hourly compa-ratio and percentile.
- In the filters, a Worker type group with Employee and Contractor chips appears as soon as you have at least one contractor.
Example
Employee
Annual total compensation
€ 82.000
14 pays |Full time (40 hours per week)
Market position
Percentile
Contractor
Hourly rate
€ 62,50 /h
Contractor|Full time (40 hours per week)
Market position
Percentile
Changing someone's worker type changes the unit of their salary, so update the amount at the same time: switching an employee on 58.000 EUR a year to Contractor without entering their hourly rate would leave 58.000 EUR/h on their record. Contractors are also left out of the pay gap figures on Insights and get their own tab on Salary Bands; see Employees and contractors under Key concepts for how the conversion works and exactly which metrics include them.
Managing an employee record
Clicking anywhere on a row opens that employee's full profile: their details, their Career Path, a Risks tab when they're flagged for retention concerns, and buttons to edit their record, grant or manage their employee self-service access, or view their market benchmark. Selecting several rows with the checkboxes switches on an Options menu for bulk actions: copy or move employees between lists, remove them from a list, create a salary band from them or add them to one (see Salary Bands), assign them to a manager (Owners and Admins only), or delete them. Delete also offers Delete all employees, which removes your whole roster, lists included, and only goes ahead once you type DELETE to confirm.
Below-market pay and Unequal pay are the two flags that follow an employee everywhere: as a badge in the Labels column, as a filter in the sidebar, and as a line of explanation inside their profile's Risks tab, so the same signal is never presented two different ways.
Example
Filter by Label
Worker type
Gender
| Employee | Level | Location | Base Salary | Labels | Actions |
|---|---|---|---|---|---|
|
JD
Jamie Devi
Senior Product Designer
|
Senior Professional |
Madrid
Spain
|
€68,000
In market
|
Active | View benchmark |
|
PS
Priya Shah
Backend Engineer
|
Mid Professional |
London
United Kingdom
|
£52,000
Below market
|
Below-market pay | View benchmark |
|
MK
Marcus Klein
Data Analyst
|
Junior Professional |
Berlin
Germany
|
€41,500
Benchmark unavailable
|
Missing data
Unequal pay
|
Unlock 1 Credit |
|
LO
Lucía Ortega
Contractor
Backend Engineer
|
Senior Professional |
Madrid
Spain
|
€62.50/h
In market
|
Active | View benchmark |
Lists
The tabs above the table organize your roster into lists: All employees first, then one tab per list, then + New List. A new list is not a hand-picked set of people but a rule: you choose who belongs by Entity, Location (a country, or a single city), Department, and Level, and the list always contains whoever matches right now. Values inside one filter widen the list (Spain or Portugal), while different filters narrow it (Spain and Engineering). The window shows how many employees match as you choose, and anyone you add later who fits the rule joins the list automatically.
Each list also stores its own Analysis criteria: a Pay gap limit (3%, 5%, or a Custom value) and the four Level, Experience, Tenure, and Performance toggles that decide what can justify part of a pay gap (see Insights). When you select that one list on Insights, its limit and criteria are applied, so a list for one country or business unit is always analyzed by its own standard.
Example
New List
Choose a name for your new list
Members
Entity
Location
Department
Level
You have {count} employees that match this filter right now. If new employees are added, they will be automatically added to the list.
Analysis criteria
- Save as list, at the bottom of the filter panel on Employees and on Insights, opens the same window already filled in with the Entity, Department, and Level filters you have selected and the Pay gap limit and criteria currently on screen. The Location filter isn't carried over, because the panel filters by city while a list can filter by country: add the location in the window before saving.
- Hand-picked lists still work: select employees in the table, open Options, and choose Copy to a different list or Move to different list, then pick an existing list or create a new one. These lists contain exactly the people you put in them.
- The pencil on a list's tab lets you rename or delete it. A list's filters can't be edited afterwards; to change who belongs, create a new list with the filters you want.
Career path
The Career Path tab of an employee's profile, Career path within the company, shows their history as a timeline, newest first, with when they Joined and their Tenure at the top. Each entry has the date the change took effect on the left, a headline (Hired as, Promoted from one level to another, Changed role to, Salary increase or Salary decrease, or Compensation update), the salary with its percentage change, and a line for each other thing that moved: Bonus, Stock, Variable Pay, and Benefits (marked New the first time, or with their percentage change), the Regime (full-time or part-time and hours per week), the Number of pays, and a currency change, which is flagged in red because every amount after it is in a different currency.
You don't have to keep this history by hand. Every time you save the Edit form with a change to one of the fields that make up someone's compensation, position, level, salary, bonus, stock, variable pay, benefits, regime (employment type and hours per week), number of pays, or currency, TalentUp closes their current entry and opens a new one. It first asks When did this change take effect?, with today as the default, so a raise agreed last month lands on the right date. A save that only touches other fields, such as department, entity, or gender, creates no entry and asks nothing.
Example
When did this change take effect?
It will appear on the Career path timeline from this date.
Career path within the company
For history from before you started using TalentUp, the third step of the Add employee and Edit forms has Add previous experience: position, employment type, hours per week, start and end date, salary and currency, number of pays, and optional Bonus, Stock, Variable Pay, and Benefits. For many employees at once, use Add career paths from Bulk actions (below). A complete career path is what lets you show pay progression over time, which is the kind of objective, documented criteria the EU Pay Transparency Directive expects employers to be able to explain.
Editing employees in bulk
When you need to change many employees at once, for example after an annual salary review or a reorganization, you don't have to open each profile one by one. Open Bulk actions above the table and choose Edit employees: you download a spreadsheet with everyone already filled in, make your changes in Excel, and upload it back.
- Download your spreadsheet: click Download all to get an Excel file with all your employees and their current data.
- Edit it in Excel: change any cell you need, but keep the TalentUp_ID column exactly as it is, because that's how TalentUp knows which employee each row belongs to. To add new people, type them into the empty rows at the bottom. Deleting a row does not remove that employee; use the table on the Employees page for that.
- Upload the edited file: drop the .xlsx file into the upload box, or click browse to pick it from your computer.
Example
Edit employees in Excel
Download your spreadsheet
Your employees with their current data already filled in.
Download allEdit it in Excel
- •Change any cell you need, just make sure the ID column stays the same.
- •To add people, type them in the empty rows at the bottom of the table.
- •Deleting rows here does not remove employees. You can use the table to do that.
Upload the edited file
You will see every change and confirm before anything is saved.
Upload file
XLSX only
Nothing is saved straight away. After the upload, a Review changes before applying page lists every employee To update (with the exact fields that change), every new employee To add, and any rows With errors. Only when you click Apply changes is anything saved; click Cancel and your data stays exactly as it was.
Saving changes to compensation fields this way also adds an entry to each employee's Career path, dated the day you apply them. Both the import template and the bulk-edit spreadsheet have a Worker type column, and the Salary column holds the annual salary for employees and the hourly rate for contractors, so each row's Worker type says which unit it uses. Type employee or contractor; common variants such as freelance, external, self-employed, or autónomo are also read as contractor. In a new import an empty cell means Employee, while in bulk edit an empty cell keeps the current type, so an older spreadsheet can never turn a contractor back into an employee by accident. A type change shows up on the review page like any other field:
Example
| ID | Employee | Changes | |
|---|---|---|---|
| 1042 |
Lucía Ortega Backend Engineer · Madrid |
Salary58000→62.5
Worker typeemployee→contractor
|
The Excel export of the Employees table adds the same Worker type column, so anyone reading the file can tell which Salary and band figures are hourly.
Adding career paths in bulk
To load the history of many employees at once, open Bulk actions and choose Add career paths. You download a spreadsheet with every employee's current career path already filled in, one row per entry (someone with no history yet gets one row built from their current data), add the earlier entries in Excel, and upload it back.
Example
Add career paths
Download your spreadsheet
Your employees with their current career paths already filled in.
DownloadAdd their career history in Excel
- •Add one row per entry of an employee's career. To add an entry, copy the employee's row and change what differs (position, level, salary, hours per week…).
- •Keep the TalentUp_ID the same on every row of the same employee.
- •Every entry needs a start date and an end date. Only the current entry has no end date.
- •This file does not create employees and does not delete any entry.
Upload the edited file
You will see every change and confirm before anything is saved.
Upload file
XLSX only
- Columns: TalentUp_ID, Employee name, Position, Seniority / Level, Employment type, Hours per week, Start date, End date, Current?, Annual salary / Hourly rate, Currency, Number of pays, Bonus, Stock, Variable pay, and Benefits. TalentUp_ID, Position, Start date, and the salary are required; empty optional cells fall back to sensible defaults (full time, 40 hours, 12 pays, the employee's currency).
- One row per entry. To add an earlier role or salary, copy the employee's row, keep the same TalentUp_ID, and change what differs. Every entry needs a start date and an end date, except the current one, which has no end date. Dates are easiest as year-month-day (2024-01-31).
- Add or overwrite, never delete. A row with the same TalentUp_ID and Start date as an existing entry overwrites it; any other row is added. The file never creates employees and never removes an entry, so rows you leave out are simply kept.
- The timeline has to make sense. Each employee needs exactly one current entry, it must be the latest, entries can't overlap (one may end the day the next starts), and the first can't start before the employee's join date. If any row of an employee breaks these rules, that whole employee is skipped, so a history is never saved half right.
Nothing is saved on upload. Review career paths before applying sums up the file in four counters, Employees to update, Entries to add, Entries to overwrite, and Rows with errors, and shows one card per affected employee with what will be added or overwritten and a Show career path link to preview the resulting timeline. When the current entry changes, the card warns that this will also update the employee's current data, such as their salary on the Employees table. Employees whose rows came back exactly as downloaded don't get a card; they're only counted as unchanged at the bottom of the page, so the review shows only what actually changes. Untick anyone you want to leave out and apply the rest.
Example
Review career paths before applying
Double-check everything below before it's saved to your account.
3
Employees to update
5
Entries to add
1
Entries to overwrite
1
Rows with errors
Jamie Devi
#1042 · Senior Product Designer · Madrid
2 entries to add 1 entry to overwriteThis will also update the employee's current data
Entry starting 01/01/2024
Insights
Insights turns the same employee data from the Employees page into company-wide analytics: pay statistics, workforce risk, and gender pay gap, refreshed automatically as you add or update employees. Where Employees shows you one person at a time, Insights shows you the whole picture.
What's on the page
- Risks detected is a plain-language summary at the top of the page, shown only when something needs attention, with a Manage employees at risk button that links straight to the people behind it.
- Pay statistics shows mean and median pay for everyone, and again split by gender, each compared against the sector average. A Yearly / Hourly switch on the card turns the six figures into hourly pay: each employee's total compensation divided by their own working year (hours per week × 52, or 40 hours when none are recorded), so part-time and full-time employees are compared on equal terms, which is how the EU Pay Transparency Directive asks pay gaps to be measured. The sector average tags don't change, and the page always opens on Yearly.
- Workforce risk analysis is the compact summary card: how many employees have enough data to be analyzed, what share of them are Stable versus At risk, and three tiles for average compa-ratio, average tenure, and turnover, which only appear once they cross a concerning threshold.
- Gender gap, Variable pay by gender, General gender pay gap, Pay gap insights, Tenure distribution, and Pay gap per level are a set of charts breaking the same data down by gender, level, and tenure, so you can see not just that a gap exists, but where it concentrates.
Example
Risks detected
Pay statistics
€54,200
€51,900
€51,800
€50,200
€56,100
€53,400
Workforce risk analysis
Gender gap
Gender gap
BalancedVariable pay by gender
General gender pay gap
Paygap > 5%Pay gap insights
UnjustifiedTenure distribution
Pay gap per level (quartiles)
Pay gap per job level
Pay gap per job level
Base SalaryReading the risk numbers
Three of the rows in Workforce risk analysis are clickable: Below-market pay, Missing data, and Gender gap each open a list of exactly the employees behind that number, with a link straight to their profile. The other risk signals TalentUp calculates, unequal pay and benchmark unavailable, still count toward Stable/At risk and the sector comparisons, but on this page they surface through the Employees page's Label filter and the Risks tab in an employee's own profile rather than through a row of their own here.
Turnover here is year to date: the share of your current headcount who left this calendar year. Compa-ratio is the same median measure used everywhere else in the platform (see Compa-ratio under Key concepts), just aggregated across your whole team instead of one employee.
Contractors are left out of every pay figure on this page: mean and median pay, the gender and variable pay gaps, Pay gap insights, Pay gap per level, average compa-ratio, and the tenure charts. Their salary is an hourly rate, so mixing it into these numbers would distort them; what you see here always describes your employees only.
Filtering and exporting
Filters are hidden by default. Add filter opens the same sidebar as Employees (position, department, level, location, gender, salary range, and Label), plus a List group once you've created lists, and every chart on the page updates live once you apply one. Save as list, at the bottom of the sidebar, keeps what you're looking at as a list, together with the pay gap limit and criteria on screen (see Lists under Employees). Generate report exports the current view to Excel.
The entity or location selector next to Generate report works exactly as on Employees: it narrows the page to one entity and, through its info button, shows the pay transparency rules of the countries where those employees work (see Entities, locations and pay transparency rules under Employees).
Pay gap limit and analysis criteria
Adjust Criteria sets how Insights judges a gender pay gap. The Pay gap limit is the gap above which the gender gap charts flag a problem: choose 3%, 5%, or Custom for any value between 0 and 100. The default is 5%, the threshold at which the EU Pay Transparency Directive requires a joint pay assessment; a stricter 3% is useful when you want early warning well before you reach it. The limit is shared by everyone in your company and saved separately for each entity or location in the selector, so each part of the business can be held to its own standard.
The four toggles, Level, Experience, Tenure, and Performance, decide which factors can justify part of a pay gap before the rest counts as unjustified in Pay gap insights. They start switched off and are remembered in your browser. A list carries its own limit and toggles, which are applied when you select that list.
Example
Adjust Criteria
Define the criteria weights you want to use in the analysis.
Grading
Grading is where you browse, and choose, the leveling framework the rest of the platform grades your employees and market searches against. Every system framework's full level list is there to browse, whether or not you're the one who can activate it.
The dropdown at the top lists every system framework, TalentUp Seniority, TalentUp Levels, Gradar, Korn Ferry, Mercer, Radford, WTW Career Level, WTW Global Grade, plus Personalized Levels, with a checkmark next to whichever one is currently your company's default. Picking a different one just previews its levels; nothing changes company-wide until you click Set as default. Frameworks vary a lot in size: TalentUp Seniority has 14 levels in 6 categories, Gradar has 19 numbered levels, Korn Ferry runs from grade 04 up to 99. Each level shows a short description you can expand for more (impact, expertise, complexity, scope of work, leadership, whenever those are defined).
- Start Now begins a Personalized Levels framework: Add a level with a code (like P1), an optional category, a title, and a description of scope and responsibilities, then repeat for every level you need.
- Levels can be dragged to reorder, within a category or between categories, and each one can be mapped to up to two equivalent TalentUp levels, so market data still matches even though the level names are entirely your own.
- Once you have a personalized framework, Edit reopens it for changes, and Save or Cancel commit or discard everything you touched in that session.
Every new account starts with TalentUp Seniority already set as the company default, on every plan. That means the Level column on Employees, the bands on Salary Bands, and the level breakdowns on Insights and Benchmark Comparison all work from day one, without choosing a framework first.
Building a Personalized Levels framework, and setting any framework as your company's default, both require a Pro or Premium plan. On Free, you can still browse every system framework's levels, but the Personalized Levels tab shows an upgrade prompt instead of a builder, and Set as default is disabled, so your company keeps working with TalentUp Seniority.
Whatever you set here is what shows in the Level column on Employees, what Salary Bands draws one band per, and what Search Salaries and every other market search converts its raw seniority data into.
Example
Support
Individual Contributor
Management I: Managers
Management II: Directors
Executives I: Heads and VPs
Executives II: C-Suite
Personalized Levels
Salary Bands
Salary Bands draws one band per grading level, with your employees plotted on it as dots, so you can see at a glance who's paid below, within, or above the range for their level.
Each band shows a minimum, a midpoint, and a maximum. Employees appear as small dots positioned by their salary: navy for in band, red for below the minimum, teal for above the maximum, and a hollow gray dot on levels without enough market data to draw a band at all. Employees paid close together cluster into a numbered circle instead of overlapping; hovering any dot or cluster shows that employee's name, level, position, salary, status, and compa-ratio, calculated against that band's own midpoint rather than the market-wide compa-ratio used on Insights and Benchmark Comparison, without needing to click through anywhere.
- Compensation type switches every band between base salary and total compensation (base plus bonus and stock).
- Midpoint is the market percentile a band is centered on, P10 through P90, P50 by default, or you can fix it to a number of your own.
- Band spread sets how far the minimum and maximum sit from the midpoint, from 10% to 30%, 20% by default.
- Compare against narrows the market data a band is built from by sector, company type, headcount, funding, or revenue, the same filters available on Search Salaries.
These settings apply company-wide by default, but every level also has its own gear icon to override just that level; changing the general settings afterward asks whether to keep those per-level overrides or apply the change everywhere.
Beyond the default view of everyone, you can save a named salary band as a reusable slice: pick an entity, location, department, or level to filter to, and optionally give that slice its own Compensation type, Midpoint, and Band spread instead of the company defaults. Saved bands show up as tabs above the chart and can be edited or deleted at any time.
A band can also be a fixed group of specific people instead of a filtered slice. In the Employees table, tick the people you want, open the Options menu, and choose Create salary band: Salary Bands opens with the new band's form already filled in, with those people listed under Employees in this band. Name it, keep the default settings or customize Midpoint, Band spread, and Compare against, and save. The band stays fixed to exactly those people, so no entity, location, department, or level filter applies to it, and each person is drawn on the level they hold.
To grow the group later, tick more people in Employees and choose Add to salary band in the same menu, then pick the band; only fixed-group bands are listed, because a band defined by filters always takes its members from those filters. To remove someone, edit the band and delete them from the Employees in this band list. Both options work from the default All employees view of the table, not from one of your own lists.
A fixed group holds only employees or only contractors, never a mix, since annual salaries and hourly rates can't share a band. If your selection mixes the two, TalentUp asks you to pick one type, and Add to salary band only offers the bands that match the people you ticked.
Two banners can appear above the chart. One warns when your employees span more than one location, department, or currency, since a single band can blur together numbers that shouldn't really be compared. The other warns when some employees sit on a level outside your active grading, since those employees are left out of every band until their level is fixed, with a link straight back to Employees to update them.
Bands for contractors
Contractors are paid by the hour, so they can't share a band with employees paid by the year: a 62,50 EUR/h rate plotted on an annual axis would look almost 100% below every band. Salary Bands keeps the two populations apart instead. All employees only ever shows employees, and as soon as your company has at least one contractor a second tab, All contractors, appears right next to it. Try both tabs in the example below.
- Bands from the contractor market: every percentile behind a contractor band is the annual market salary converted to an hourly rate (× 2 ÷ 2,080), so the midpoint, minimum, and maximum are all hourly and the contractors' own rates are plotted on them as they are.
- An hourly axis: the header reads Bands · EUR/h, the scale adapts to hourly amounts (30, 40, 50 and so on) instead of thousands, and tooltips show each rate with two decimals and /h.
- Its own settings: Midpoint, Band spread, and Compare against are saved separately for the contractors tab, so tuning one population never changes the other. A fixed midpoint is entered as an hourly rate and accepts decimals.
- No Compensation type: the base salary versus total compensation switch is hidden, because contractors have no bonus or stock; contractor bands always use the base rate.
Example
Create a new salary band
Who is this salary band for?
With contractors on the roster, New salary band starts by asking Who is this salary band for?: Employees (annual salaries, compared with the market salary) or Contractors (hourly rates, compared with the market contractor rate). A saved band only ever holds one of the two and starts from that population's settings, and a contractor band shows Contractors · hourly rates under its title while you edit it. Companies without contractors skip this step and go straight to the band editor.
The same split drives the market-position badge on Employees: each contractor's Below market, In market, or Above market status comes from the contractor bands, never from an annual one.
Unlike most other pages, Salary Bands has no Excel export or share link. It's a live, in-app view only.
Example
Settings
Compensation type
Midpoint
The percentile you choose becomes the midpoint of your band, calculated from TalentUp market data for each level.
Band spread
Job Level Evaluation
Job Level Evaluation levels a role before anyone has been hired into it yet. Paste in a draft job description, drop a file onto the box, or attach one, choose a grading framework, and an AI assistant reads the text against that framework's own level definitions, the same ones your Grading page stores, never a generic list, so the level it suggests is one you can actually use on Employees and Salary Bands right away.
This is a short conversation, not a single lookup. If the description doesn't say enough about scope of influence, whether the role manages people, or seniority and years of experience, the assistant asks one short clarifying question at a time, up to two questions in total. After that it commits to a result using its best estimate, lowering the confidence score rather than asking indefinitely.
What you can evaluate against
- Framework offers TalentUp Seniority, TalentUp Levels, and your company's own personalized grading when you've built one; the third-party frameworks available on Grading (Gradar, Korn Ferry, Mercer, Radford, WTW) aren't offered here, since TalentUp only has rights to evaluate against its own level definitions.
- Attachments accept a .txt, .md, .docx or .pdf file up to 5 MB; the text is extracted straight into the box so you can review or edit it before evaluating, exactly as if you'd pasted it yourself.
Reading the result
The result is a card with a level badge, a one-sentence summary of what that level does, and a short Why this level list explaining the reasoning, including why the adjacent levels don't fit as well. The confidence score (0 to 100) is the assistant's own certainty about the match, not a statistical measure; treat a low score as a signal to review the level yourself, in particular by asking a follow-up question in the same conversation, rather than accepting it as final.
Acting on a result
From that result card, View benchmark opens Search Salaries pre-filled with the detected job title and, when it can be resolved, your own location, so you can immediately see what the market pays for that level. Add as employee opens the Add Employee form in place, pre-filled with the detected position and level, so a role that has just been leveled can be turned into a real headcount entry without leaving the page or re-typing anything.
Every completed evaluation is saved to Recent evaluations on the landing screen, so a role you leveled last week is one click away to review again or continue the conversation with a follow-up question.
This is where a compensation team can answer what level a new role should be in minutes instead of waiting for the next calibration session, whether the role comes from a hiring plan, a reorg, or a request from another department. Keeping every new role's level grounded in the same framework your existing employees are graded against matters beyond internal consistency: under the EU Pay Transparency Directive, comparable-work analysis and gap reporting depend on a job architecture that doesn't drift over time, and a role leveled ad hoc, outside the framework, is exactly the kind of gap an audit or a works council would flag.
Example
Growth Marketing Manager — own paid acquisition across Google and Meta, set the channel budget, and manage one Paid Media Specialist who reports to this role. Reports to the Head of Marketing. Requirements: 5+ years of paid media experience.
Does this role have full autonomy over the budget it manages, or does spend above a certain amount need sign-off from the Head of Marketing?
Based on what you described, I would suggest you position this role:
Owns a marketing sub-function with a small team, working within a broader strategy set by senior leadership.
Why this level:
- Manages one direct report and has partial budget authority, beyond an individual-contributor level.
- Spend above €20k requires sign-off and scope is limited to one channel area, rather than full P&L ownership of the marketing function.
Market Salary Search
Search Salaries
Search Salaries is the core market-data search behind the whole platform: pick a position and a location and get back salary percentiles by seniority level, a bonus and stock breakdown, and a full benefits benchmark, all for that exact combination. Three things make up the page: the search form that defines what you're looking for, the pay table that shows what the market pays, and the benefits section that shows what the market offers beyond salary.
The search form
Searching works in one of four mutually exclusive modes, switched with the Search by toggle: Position is the default and always available; Department, Category and Location (searching every position in a place at once) are Premium features. Position search is an autocomplete box, so you can also click Match description next to it to paste a job description instead of typing a title and let TalentUp match it to the closest real position for you.
Location is a single place, matched against a real list of cities and countries as you type; there is no remote or anywhere option, since the market data itself is always tied to a specific place. Personal accounts have their position and location locked to what they entered at signup, so the benchmark always reflects their own profile rather than a place they don't actually work.
- Sector and Keywords narrow the companies behind the data by industry or by free-text terms (up to 5 of each).
- Company type picks one of Startup, Scaleup, International, IT Consultancy or Research / SMB.
- Any versus International: Any uses all the salary data for that position and location. International uses exactly the same data, then applies a country-specific adjustment that reflects what companies hiring globally pay in that country, which is usually above the local market. Both options draw on the same sample, so they show the same number of observations. Choose International when you compete for talent with global employers, and Any when you benchmark against the local market.
- Number of employees, Funding and Revenue are range sliders that narrow the market data to companies of a similar size or stage.
- Peer group narrows results to a named set of companies you chose yourself, rather than a size or industry bucket; it's a Premium feature, built from the Company Finder page, and only usable once a group has at least 5 companies in it.
The Premium plan also gets an AI-powered search box: describe what you're looking for in a sentence, in any language, for example how much a Frontend Developer earns in Barcelona for startups with 20 employees, and TalentUp reads it and detects the position, location and filters for you. Nothing runs automatically: the detected filters appear as removable chips for you to check, with an Edit button to go back to plain text and a Search button that only then runs the actual search.
Running a position or department search that isn't in your history yet uses 1 credit, shown next to the Search button when it applies; your remaining credits are always visible on the Dashboard. Every past search is kept under the Search History tab next to the filters, one click away to reopen, and once you're viewing a result, a Save benchmark button lets a company account keep it as a named, reusable benchmark it can come back to and keep in sync with the filters used to build it.
Example
Search by
Position*
Match descriptionLocation*
Salary Range Results
Frontend Developer in Barcelona
Sector
Company type
Keywords
Number of employees
Funding (€)
Search and filter instantly with AI
Reading the results table
The pay table has up to three tabs: Salary (always available), Bonus and Stock (Premium, and only shown at all when that position actually tends to offer them). Each tab lists one row per seniority level with five columns, P10, P25, P50 (the median), P75 and P90, or Min, Avg, Max instead when there isn't enough data for a full percentile spread. A level with more than one experience bracket expands into a breakdown by years of experience; switching the grading dropdown swaps which leveling framework labels the rows, the same frameworks offered on Grading and Job Level Evaluation.
Four controls change how the same numbers are displayed without changing what they mean: compensation basis (Gross, Net, Company Costs or Contractor) switches instantly since all four are already loaded; period (yearly, monthly, weekly or hourly), currency and the historical date range (from three years ago up to a projected next year) each reload the page with the converted or recalculated figures, since those depend on exchange rates and time-based data that live on the server.
A position and location combination you haven't searched before shows dashes instead of numbers until you spend 1 credit to unlock it; once unlocked, it's saved to your profile for future reference and stays unlocked for your whole team for one year. The blue market compensation card above the table turns the row you're most interested in into one headline number, split into a base, bonus and stock bar when those apply, and a Market Analysis card underneath, marked AI Generated, adds a short written summary of what's driving that number.
- Download Report and Download Excel buttons above the pay table, and a Save benchmark button (company accounts), let you take the current view with you or keep it as a reusable, named benchmark. Both downloads are explained in detail below.
- The Add & Compare card lets a company add one of its own employees straight from the results, showing immediately how that person's pay sits against the percentile you're looking at.
- Personal accounts see an Export data option instead, generating a certified Salary Benchmark Certificate PDF with the percentile ranges, bonus and stock data, and the filters used, useful for salary negotiations or as supporting documentation.
Example
Market Analysis
AI GeneratedFrontend Developer salaries in Barcelona sit close to the national average, with the widest gap between Junior and Mid driven by demand for React experience…
Total Yearly Market Compensation
Good48,500 €
Pay table
TalentUp (Seniority) grading | Gross Salary, Yearly | N° of observations: 1016
Benchmark participants
Companies whose employees contributed to this benchmark
Downloading the benchmark
Once a position is unlocked, two buttons sit at the top right of the pay table, next to the Gross and period selectors: Download Report and Download Excel. Both export exactly the search you are looking at, with the same position, location, filters and currency, so what you share always matches what you saw on screen.
- Download Excel gives you the raw numbers in a spreadsheet: every level and percentile of the pay table, ready to filter, chart or paste into your own salary review model. It is available on the Pro and Premium plans.
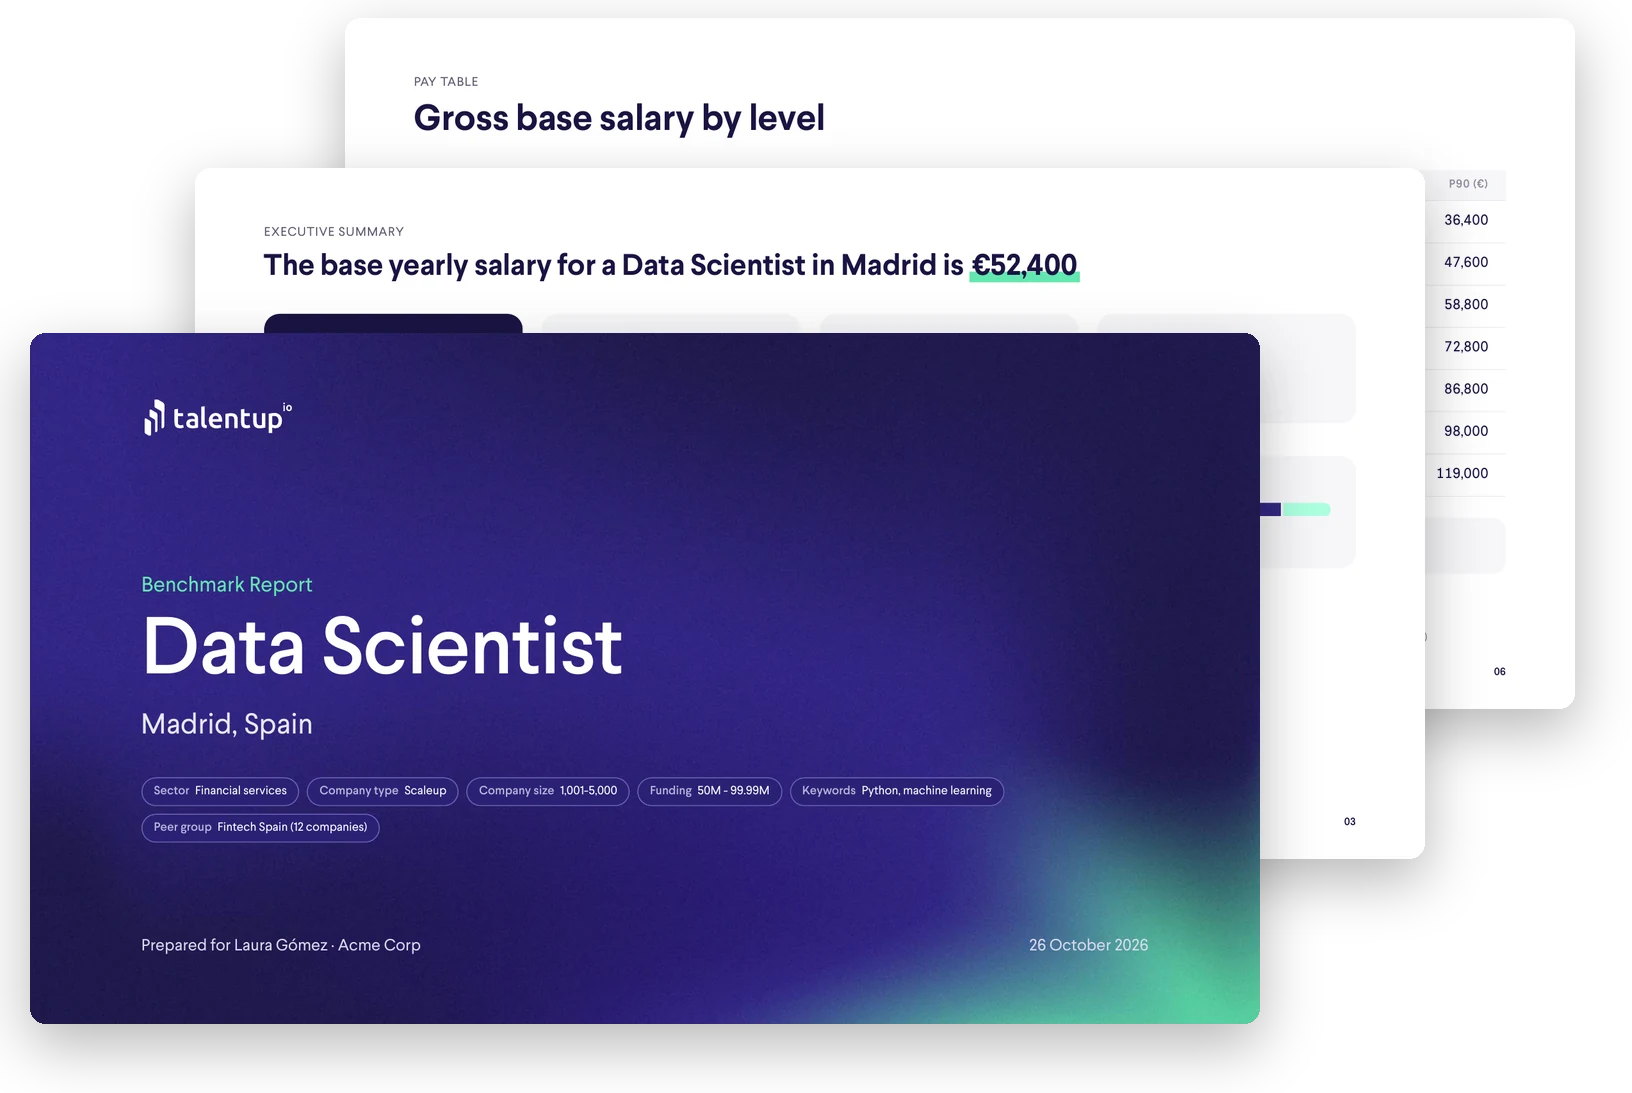
- Download Report opens a short preview of what the report contains and, after you click Download PDF, generates a presentation-ready PDF of the whole benchmark in a few seconds. It works on any plan, as long as the position is unlocked.
The report is designed to be shared as is, with a leadership team, a hiring manager or a candidate, without rebuilding slides by hand. It opens with a branded cover showing the position, the location and who it was prepared for (your name and company), followed by a contents page and these chapters:
- Executive summary: the median salary, the total compensation (base plus average bonus), the confidence of the data and how the role compares with the average for that location.
- Market analysis: the AI generated summary of what is driving pay for the role, the same one shown in the Market Analysis card.
- About the role: what the position does at each level, plus the other job titles it is also known as.
- Pay table: gross base salary percentiles, from P10 to P90, for every seniority level.
- Bonus, stock and cost: bonus and stock percentiles by level, how many companies offer them, and the median salary as gross, net and company cost.
- Market insights: supply and demand for the role, the gender split and the pay trajectory.
- Benefits: what companies offer for this role, with their typical cost.
- About the data: where the data comes from, how it is processed, the filters behind the search and a glossary of key terms, so anyone reading the report can trust where the numbers come from.
Example
Download a PDF with your benchmark
Frontend Developer · Barcelona
What you'll get
- Pay by level: salary percentiles (P10–P90) for every seniority level.
- The full compensation picture: bonus, stock, net salary and company cost.
- Market context: AI market analysis, supply and demand, gender gap and pay trajectory.
- Benefits: what companies offer for this role, with their typical cost.
Presentation-ready PDF · Includes the data sources and methodology
Benefits
Below the pay table, the Benefits section shows what companies matching your search tend to offer beyond salary, grouped into cards by category: work-life balance, health and well-being, financial benefits, technology and equipment, professional benefits, transportation and others. Every benefit is curated and filtered to your exact position and location, not a generic list, so what you see is what's actually relevant to that search.
Each benefit expands to show a short description and, when it applies, a value badge: a monetary amount, a percentage of salary, Non monetary, or Variable. A separate gray Statutory benefit pill marks entitlements that are required by local law rather than offered at a company's discretion, such as paid leave, kept in its own cards so legal minimums are never confused with optional perks a company chooses to offer on top. Since contractor rates don't come with company benefits, the whole section is hidden automatically when you switch the pay table to the Contractor basis.
Calculating the total compensation package
Salary is only part of what a company pays. To see the full picture, company accounts get a Build your compensation package banner right under the Benefits title. Click Calculate and the compensation calculator opens next to the benefits list, already filled in with the market base salary, bonus and stock for the level you are looking at, and a checkbox appears on every benefit.
Tick the benefits you offer, or plan to offer, and each one is added to the calculator with its yearly value, so the Total at the bottom updates as you go and shows the total compensation of the package: base salary, bonus, stock and the total variable pay of the selected benefits added together.
- Benefits with a fixed cost are converted to a yearly amount, so a monthly meal voucher counts twelve times. Benefits paid as a percentage of the salary are calculated from the base salary in the calculator and recalculate when you change it.
- Benefits that cannot be priced, such as non monetary or variable benefits and statutory benefits required by law, show a disabled checkbox; hover over it to see why it is not added to the total.
- Every amount is editable. Type your own base salary, bonus, stock or benefit value to model your real offer; a Reset link brings back the market value.
- The level button at the top of the calculator switches between Median and each seniority level; clicking any salary figure in the pay table does the same, and the base salary, bonus and stock follow it.
- A Custom benefits card lets you add anything the market list doesn't include, with your own name and yearly amount. Custom benefits are only kept while the page is open.
This turns a market benchmark into a concrete offer: you can check whether a candidate's expectations are realistic once benefits are counted, explain to an employee what their package is really worth beyond salary, or compare two ways of reaching the same total. The calculator needs the position to be unlocked; on a locked position the Calculate button invites you to upgrade instead.
Example
Benefits
Build your compensation package
Select the benefits you offer and see the full package next to the market salary.
Work life balance
Health & well being benefits
Financial benefits
Search Salaries is usually the first stop for building a role's compensation, but it also feeds directly into pay equity work: the same percentile ranges and benefits benchmark are what a compensation team leans on when setting a pay range to publish in a job posting or when preparing the comparable-work analysis the EU Pay Transparency Directive asks for, since both need a defensible, up-to-date view of what the market actually pays for a role, not just what the company has paid for it historically.
Benchmark Comparison
Benchmark Comparison is a single table where every position you've unlocked or saved from Search Salaries lands automatically, side by side, so you never have to flip between separate searches to compare roles. You can also bring in a brand-new position without leaving the page: + Add Row opens the same position and location search as Search Salaries, and once you pick both, the row prices itself in place, spending a credit and saving it to your profile if it's not unlocked yet, exactly like unlocking from Search Salaries would.
Every cell in a row, not just the salary, is editable in place: Level, Sector, Company type, the Employees, Funding and Revenue ranges, and Keywords are all dropdowns or inputs you can change directly in the table. Edits save automatically a few seconds after you stop, or immediately if you click away, and the row's Compa and Market P10-P90 columns recompute right after, so this doubles as a live what-if tool: reshape a row's filters and watch the market numbers move, without ever leaving the table or spending another credit.
Salary is the number you type in, typically what you actually pay someone in that role, and Compa is that salary divided by the market median (P50) for the row's exact filters, shown as a percentage; 100 means paying exactly the median. If a row's filters are narrow enough that there's no market data for that precise combination, TalentUp automatically retries with broader ones, dropping funding and company size, then narrowing to sector alone, then no filters at all, until it finds real data rather than leaving the row blank.
- Table settings sets defaults for the whole table at once: Salary (base only, or base plus bonus), Currency, and Salary basis (the pay period, yearly through hourly); each column also has its own override there (Sector, Company type, Employees, Funding) that applies that one value to every row in a single click, without losing anything you've already customized per row afterward.
- The search box filters which rows are shown, and the download icon exports the table exactly as it's currently configured, filters and all.
- Column headers sort the table, and Table settings also lets you show or hide whole columns you don't need for a given comparison.
Example
Adding benchmarks in bulk from Excel
When you have more than a handful of roles to price, for example every open requisition for next quarter or a whole job architecture you're building, adding them one by one with + Add Row gets slow. Add via Excel, right next to it under the table, loads up to 100 benchmarks at once from a spreadsheet. It only ever adds new rows: an upload never edits or removes the rows already in your table, so you keep changing those directly in place.
- Download the template: an empty .xlsx file with one column per benchmark filter: Position, Location, Level, Sector, Company type, a min and a max column each for Employees, Funding and Revenue, and Keywords.
- Fill it in: only Position and Location are required, everything else is an optional filter. The optional columns come with dropdowns, so you always pick from the exact values TalentUp accepts. Positions are matched against TalentUp's job catalog, so use the role's usual name, and a location is a city. An empty Level defaults to Mid, a range with only a min or only a max is completed automatically (from 0, or up to the top of the scale), and several keywords are separated by commas.
- Upload the filled file: drop the .xlsx file into the upload box, or click browse to pick it from your computer.
Nothing is created straight away. TalentUp first checks every row and shows you a preview: rows it can't use are listed with their row number and the reason (an unrecognized position or location, a level, sector or company type outside the accepted values, or a range whose min isn't below its max) and are simply skipped, while the valid ones wait for you. The preview also tells you exactly how many benchmark credits the upload will spend before you click Confirm.
Example
Add benchmarks via Excel
Download the template
An empty spreadsheet with the columns a benchmark needs.
Download templateFill it in
- •Position and Location are required, the rest of the columns are optional filters.
- •Up to 100 rows per file.
Upload the filled file
Each new row uses 1 benchmark credit. You'll see the total cost and confirm before anything is created.
Upload file
2 rows will be skipped:
- Row 5: Unrecognized position: Chief Vibes Officer
- Row 9: Unrecognized location: madird
You will spend 8 benchmark credits.
ConfirmCredits work exactly like unlocking from Search Salaries: a position and location you've already unlocked costs nothing, and each new position and location pair costs 1 credit, charged only once even if it appears on several rows with different levels or filters. If you don't have enough credits for the whole file, the preview tells you, and only that many new benchmarks are unlocked, in file order, with a link to buy more credits and upload the rest. On plans with unlimited benchmarks there's nothing to confirm and the rows are created right away. Once created, the new rows appear in the table already priced with their own filters, ready to edit in place like any other row.
This is the page to reach for when a decision depends on comparing several roles at once rather than one at a time: benchmarking every open requisition before finalizing offers, checking a handful of roles for pay equity in one pass, or building the comparable-work view the EU Pay Transparency Directive asks for, where several similar positions need to be assessed side by side rather than as isolated searches.
Company Finder
Company Finder works two ways from the same search bar, and the two are mutually exclusive: type a specific company's name to open its own profile, or leave the name empty and use the filters to screen the whole company directory instead. Selecting a company clears any filters, and picking a filter clears the company name, so you're always in one mode or the other, never both at once.
Looking up a single company
The company field is an autocomplete search against TalentUp's real company index, showing each match's logo as you type. Once you open a company, its profile starts with a short written summary (when it was founded, its city and country, its sector, roughly how many employees it has, whether it pays above, around, or under the market average, and its median yearly salary), and a sticky bar with Sector, Employees, Funding, and Revenue badges stays pinned as you scroll so you never lose track of which company you're looking at.
The Average Total Yearly Compensation card puts the company's own median salary on the same bar as its sector's median, so you can see at a glance whether it sits ahead of, level with, or behind similar companies, and a short written note underneath grades exactly how far ahead or behind it is, from broadly in line with the sector to substantially above or below it.
The Offer and Professionals Map is a world map shaded by country, built from two different signals TalentUp already tracks for that company: how many people list it as their employer, and how many job postings it currently has open, in each country. The table underneath the map turns that into a hiring ratio per country and calls out whether the company looks understaffed for its hiring activity (a hiring-heavy, low-supply market) or the opposite.
Positions and salaries is a flat table of individual, real salary data points reported for that company, position by position and city by city, not an aggregated range; a free plan sees the first 3 rows for free and every row after that shows an Upgrade or Login button in place of the number. Last offers published shows up to 3 real job postings TalentUp has found for that company in the last three months, each with a View position button that jumps straight to Search Salaries pre-filled for that exact role and location, and a Job offer button that opens the original posting; on a free plan these are 3 illustrative example cards rather than the company's real postings.
Example
Acme Technologies
Acme Technologies is a company founded in Barcelona, Spain, in 2015. It operates in the Technology sector and has over 200 employees. Acme Technologies offers above-average salaries compared to other companies in the market. The median salary of an employee at Acme Technologies is 52,000 € yearly.
Average Total Yearly Compensation
Good52,000 €
Sector Median vs Company
Salary Variation
Compensation at this company exceeds the sector average, with employees earning around 18% more than similar roles elsewhere in the sector.
Offer and Profesionals Map
Positions and salaries
Last offers published
Backend Developer
In offer 48,000 €Screening the company directory
Leave the company field empty and use Keywords, Location, Sector, Company type (Startup, Scaleup, International, IT Consultancy, or Research / SMB), Number of employees, Funding, Revenue, or a saved Peer Group to screen the whole directory instead of looking up one company. The result is a table, not a hiring feed: each row shows a company's logo and name, sector, size, funding, revenue, location, and a few of its keywords, and the small info button on a row opens that company's own profile exactly as described above, so the directory's real job is helping you find the right company to look up next, or the right set of companies to save as a Peer Group.
Example
Showing 1 to 2 of 42 companies
Building a Peer Group
A Peer Group is a named, reusable set of companies you build yourself, once it has at least 5 companies in it. You can build one two ways on this page: tick the checkboxes on a directory search's result rows and use Add to peer group or + Create peer group, or open the standalone Peer Groups manager from Company Finder's own landing screen and search for companies one at a time to add to a new or existing group. However you build it, a Peer Group then shows up as a one-click filter here on Company Finder, and, on Premium, on Search Salaries too, to narrow market data down to the specific competitor set you actually recruit against or benchmark yourself to.
Company Finder is where the company side of a compensation strategy gets grounded in something concrete: which companies you're actually competing with for talent, and what they pay. That matters beyond internal planning, since the EU Pay Transparency Directive's comparable-work analysis implicitly asks who your company should be measured against in the first place, and a Peer Group built here is exactly that comparison set, reusable everywhere else in TalentUp that accepts one.
Compare Salaries
Compare Salaries puts up to 10 roles across up to 10 locations side by side in one view, everything expressed relative to a single Reference Location you choose, rather than comparing every location to every other one at once. It's a Premium feature end to end: on any other plan, the Compare button on the search form is disabled outright, and the page shows an upgrade prompt instead of results.
Setting up a comparison
Position and Location are separate autocomplete fields, each capped at 10 entries, and Reference Location is its own required field rather than just a toggle on one of the locations you already picked; it's the fixed point every number in both result tables is measured against, marked with a star throughout. Sector, Number of employees, and Funding narrow the underlying market data the same way they do on Search Salaries, while Bonus, Seniority, Percentile, and Currency sit as dropdowns above the results themselves and reload the comparison with the new setting.
Reading the results
The Salaries Comparison table lists one row per position and one column per location, the reference location starred and currency-labeled like every other column. Each cell shows the salary itself plus a small green or red percentage showing exactly how far above or below the reference location that figure sits, and the grouped bar chart underneath turns the same numbers into one colored bar per location so the spread is visible at a glance.
The Information comparison table underneath uses the same location columns but swaps in eight pieces of context instead of salary: Cost of Living, a Salary / Cost of Living Ratio (shown as a plain-language band from Very Low to Excellent rather than a raw number), Supply and Demand for that role locally, a Supply / Demand Ratio, Inflation, Population, and Unemployment. Cost of living, supply, and demand also carry the same green or red percentage versus the reference location as the salary table does.
Exporting and history
An Excel export captures the comparison exactly as configured, and like the results themselves it's only available on Premium. Search History keeps every past comparison one click away to reopen, the same pattern used across the rest of Market Salary Search.
This is the page for decisions that hinge on where a role is based, not just what it's worth: choosing between candidate locations for a new hire, sizing a relocation package, or explaining to someone internally why the same role is paid differently in two of your offices once cost of living and local market conditions are accounted for, an explanation that matters as much for internal fairness as it does for the comparable-work reasoning behind the EU Pay Transparency Directive.
Example
Salaries Comparison
Information comparison
Guides
How to benchmark your first employee?
Benchmarking your first employee takes five steps, from adding them to reading their first market comparison. Every page mentioned here has its own full section later in this documentation.
- Add the employee on the Employees page: fill in their name, department, position, location, and salary. Adding more than one? Drag in the Excel template from Import employees instead, or connect an HRIS (Personio, HiBob, or AlexisHR) from Connect your HR system in the same window so employees sync automatically.
- Give them a level: your company already starts on TalentUp Seniority, so you can pick one of its levels (from Mid Support to C-Suite) right away. If you'd rather use another framework, switch it on the Grading page first: TalentUp Levels, a recognized market framework like Mercer or Korn Ferry, or a personalized framework built around your own levels. Then confirm the employee's level is set correctly.
- Read their market-position badge: back on Employees, that row now shows the employee's market salary range next to their actual pay, with a badge, Below market, In market, Above market, or Benchmark unavailable, comparing the two automatically.
- Unlock the full benchmark for the underlying percentiles: open Search Salaries for their exact position and location, or click Unlock directly from their row, spending a credit the first time that combination is checked.
- Once Salary Bands has a band for their level, the same employee shows up as a dot on the chart too, with their compa-ratio against the band's own midpoint, so you can see at a glance whether they're paid appropriately for their role.
How to make your first salary search?
A first search on Search Salaries takes five steps, from picking a position to reading the results. Every page and term mentioned here has its own full section later in this documentation.
- Open Search Salaries and choose how you're searching: Position is the default and always available, an autocomplete box where you can also click Match description to paste a job description instead of typing a title. Department, Category, and Location search are Premium features.
- Add a Location: a single city or country, matched against a real list as you type. This field is required, since market data is always tied to a specific place rather than remote or anywhere.
- Narrow the results if you want to, though it's optional for a first search: Sector, Company type, Number of employees, Funding, and Keywords all focus the underlying market data on a specific kind of company.
- Click Search. A position and location combination you haven't searched before costs 1 credit to fully unlock; your remaining credits are always shown on the Dashboard, and once unlocked, that combination stays visible to your whole team for a year.
- Read the results: the pay table shows P10 through P90 percentiles for each seniority level, the blue market compensation card turns the row you care about into one headline number, and compensation basis, currency, and period controls let you switch how those same numbers are displayed. The Benefits section below the table shows what companies matching your search tend to offer beyond salary.
How to run your first benchmark comparison?
A first benchmark comparison takes five steps, from adding a position to the table to reading its compa-ratio against the market. Every page and term mentioned here has its own full section in this documentation.
- Open Benchmark Comparison under Market Salary Search in the sidebar. Any position you've already unlocked or saved with Save benchmark on Search Salaries is already in the table as its own row, so you may not be starting from an empty page.
- Add a position with + Add Row: pick a Position and a Location, the same search you'd use on Search Salaries. A position and location pair you haven't unlocked before costs 1 credit, and you confirm it before anything is spent; one you've already unlocked costs nothing. Pricing many roles at once? Use Add via Excel to load up to 100 benchmarks from a spreadsheet instead.
- Shape the row to match the role you're pricing: Level, Sector, Company type, the Employees, Funding and Revenue ranges, and Keywords are all editable directly in the table. Changes save automatically and the Market P10-P90 columns recalculate right away, without spending another credit.
- Type what you pay into Salary, typically the current salary of someone in that role or the offer you're about to make. The Compa column then shows that salary as a percentage of the market median (P50) for the row's exact filters: 100 means paying exactly the median, below 100 means paying under it, above 100 means paying over it.
- Fine-tune and share: Table settings switches the whole table between Base and Base + Bonus, changes the Currency and Salary basis, and shows or hides columns. Add more rows to compare several roles side by side, and use the download icon to export the table exactly as you see it.
Integrations

Personio Integration
Connect Personio from the Integrate button on the Dashboard's employee card and enter your Personio Client ID and Client Secret (an OAuth2 API client you create in Personio, not your own login), then click Import. TalentUp exchanges those credentials for a short-lived access token, checks that it can actually read your employee roster, and only then queues the real import to run in the background, so a wrong or expired credential fails immediately with a clear error instead of silently importing nothing.
Example
Please enter your Personio API credentials to import your employees.
Personio
Personio API credentials
Where to find your Personio credentials
- In Personio, go to Marketplace and then Connected integrations. This needs Marketplace access; ask an admin on your Personio account if you don't have it yourself.
- Click Create custom integration.
- Under Readable employee attributes, check exactly which employee fields TalentUp should be able to read; TalentUp only ever sees what's checked there.
- Save. Personio generates a Client ID and Client Secret together, in one step, ready to paste into TalentUp's Integrate panel.
Personio is the one integration that keeps itself up to date on its own. Once connected, every time a member of your team logs in, TalentUp checks whether it's been a while since the last sync and, if so, queues a fresh one automatically, no manual re-import needed. Most of the time that's a quick delta sync pulling only what changed since last time; if more than 30 days have passed since the last sync, it upgrades itself to a full resync instead, as a safety net that catches anything a delta could miss and reconciles employees who've left. These automatic syncs are throttled to at most once every 20 minutes per company, so a dozen teammates logging in together only triggers one.
Personio also tells TalentUp who is a contractor: anyone whose employment type is External is imported with the Contractor worker type and benchmarked on an hourly rate. A later sync never turns a contractor back into an employee, so a type you set by hand is kept.
Because the credentials are stored against your company rather than your personal account, this connection is shared: any teammate's login can trigger the next sync, and the imported employees are available to your whole team the same way any other employee data is.

HiBob Integration
Connect HiBob from the same Integrate button, entering a HiBob Service User ID and Service token, the credentials for a Service Account created in HiBob for this purpose rather than a personal login. Click Import and TalentUp pulls your full people list from HiBob, then fetches each person's compensation individually and annualizes it regardless of the pay period HiBob reports it in.
Example
Please enter your HiBob service token to import your employees.
HiBob
HiBob credentials
Where to find your HiBob credentials
- In HiBob, go to Settings and then Service Users. This needs direct admin access to HiBob's settings; if you don't have it, ask a Bob Admin on your team to do the next two steps and share the result with you.
- Create a new service user.
- Copy its Service User ID and Service token, the exact two values TalentUp's Integrate panel asks for.
The import runs in the background, so you're free to keep working once it starts, a confirmation appears immediately and a notification tells you when it's ready. HiBob's API is fetched at a deliberately measured pace to stay within its rate limits, which means a company with around a hundred employees can take roughly ten minutes to finish importing; that's expected, not a sign that anything has stalled.
Unlike Personio, HiBob doesn't resync itself automatically. Reconnecting later, by reopening the same integration panel and clicking Import again, safely brings your employee data up to date without creating duplicates, so treat a HiBob connection as something to refresh manually whenever you know your roster has changed.

AlexisHR Integration
Connect AlexisHR from the same Integrate button and paste in your AlexisHR access token, then click Save and import. TalentUp fetches your employees from AlexisHR in one call, including their compensation, department, and employment details, and imports them in the background exactly like the HiBob flow, complete with the same confirmation and ready notification.
Example
Please enter your AlexisHr access-token to import your employees.
AlexisHr
Alexis Access Token
Where to find your AlexisHR credentials
- In AlexisHR, go to Settings and then Access tokens. Only someone with the Owner role can do this.
- Generate a new token.
- Enable it for the Public API scope, not Provisioning (SCIM), which is a different, unrelated scope.
- Copy the token immediately: AlexisHR only ever shows it once.
Like HiBob, an AlexisHR connection is a manual, point-in-time import rather than an ongoing sync: reopen the integration panel and re-enter your token whenever you want to pull in the latest changes from AlexisHR, and re-importing safely updates existing employees rather than duplicating them.
Key concepts
TalentUp Gradings
This section explains how TalentUp Gradings work across individual contributors, managers, leads, directors, heads, and executives, and how to apply them to job evaluation, salary benchmarking, and organizational design. There are two different TalentUp Gradings: TalentUp Seniority and TalentUp Levels. They're both available on the Grading page, and they're also available as a grading option on Search Salaries, Insights, Salary Bands, and Job Level Evaluation.
Download TalentUp GradingsTalentUp Seniority explained
TalentUp Seniority is the default grading for every new account. It uses the career-path terminology most HR teams already work with: 14 levels grouped into 6 categories, from Support roles and Individual Contributors (Junior to Principal Professional) through Managers, Directors, Heads and VPs, up to the C-Suite. Use this table to map your existing job titles to a level before running a salary benchmark.
| Category | Level | Description |
|---|---|---|
| Support | Junior Support | Entry-level support role that handles basic, well-defined requests with close guidance while learning the product and the support processes. |
| Support | Mid Support | Handles day-to-day support work under general supervision, solves straightforward issues on their own, and escalates complex ones. |
| Support | Senior Support | Experienced support role that takes on complex cases, trains newer colleagues, and helps improve support processes. |
| Individual Contributor | Junior Professional | Entry-level professional in fields like engineering, marketing, or finance. Completes assigned tasks under close guidance while building core skills. |
| Individual Contributor | Mid Professional | Owns individual projects or parts of larger ones with moderate supervision and growing independence. |
| Individual Contributor | Senior Professional | Works independently with minimal supervision, leads small initiatives, and mentors junior staff. |
| Individual Contributor | Lead Professional | Recognized expert who leads major projects, gives direction to other professionals, and shapes key decisions in their area. |
| Individual Contributor | Principal Professional | Top-tier individual contributor with near-complete independence. Drives major initiatives and is a leading authority in their field. |
| Management I: Managers | Manager | Leads a team: manages performance, allocates resources, and keeps the team aligned with company goals. |
| Management I: Managers | Senior Manager | Oversees large teams or several teams, builds the plans for their area, and ensures it runs efficiently. |
| Management II: Directors | Director | Leads several departments or a large function. Sets direction, manages managers, and influences company-wide policies. |
| Management II: Directors | Senior Director | Leads major organizational functions, drives company-wide initiatives, and reports to top executives. |
| Executives I: Heads and VPs | Head / VP | Heads an entire department, division, or country, with full decision-making authority in that domain and a direct hand in company strategy. |
| Executives II: C-Suite | C-Suite | Chief-level executive (CEO, CFO, COO and similar) with company-wide authority over strategy and overall performance. |
TalentUp Levels explained
The table below maps each level code, from S1 to E3, to its category, typical title, and definitions across six dimensions: autonomy, impact, expertise, complexity, scope of work, and leadership. Use it to position roles consistently when setting salary bands or designing job grades.
| Level | Category | Title | Autonomy | Impact | Expertise | Complexity | Scope of work | Leadership |
|---|---|---|---|---|---|---|---|---|
| S1 | Support roles | entry-level support | Performs routine tasks under close supervision; follows detailed instructions with limited discretion. | Provides essential operational and administrative support to ensure smooth daily business operations. | This is an entry-level position that requires basic knowledge and minimal prior experience. | Work is straightforward and procedural; limited judgment is required. | Performs clearly defined, repetitive tasks within a specific area of responsibility. | |
| S2 | Support roles | intermediate support | Handles a wider range of tasks with moderate independence; makes decisions within clear guidelines. | Supports business operations through reliable task execution and problem-solving within defined boundaries. | Has working knowledge and skills developed through training or relevant experience. | Solves routine to moderately complex problems using established procedures. | Manages varied but related tasks; contributes to improving efficiency within the team or process. | May provide guidance to colleagues with less experience on routine tasks. |
| S3 | Support roles | advanced support | Operates with minimal supervision; prioritizes tasks and solves complex issues independently. | Ensures quality and efficiency in operational processes through advanced support and problem-solving. | Has specialized knowledge and strong technical or administrative skills gained through significant experience. | Handles complex and sometimes unpredictable issues; adapts existing processes to meet business needs. | Works across multiple areas or systems; contributes to process improvement and operational excellence. | Acts as a point of reference or informal mentor for colleagues; may coordinate activities within a small team. |
| P1 | Professional roles | entry-level professional | Works on well-defined tasks under close supervision; follows detailed instructions and established procedures. | Contributes to team objectives through accurate execution of assigned work with limited individual impact. | Entry-level role requiring foundational knowledge and initial professional experience. | Performs routine and procedural assignments with guidance from senior colleagues. | Delivers specific tasks within a narrow area of responsibility. | |
| P2 | Professional roles | intermediate professional | Handles moderately complex assignments with some autonomy; seeks guidance when facing unfamiliar situations. | Has low to moderate impact on the success of own function or discipline. | Developing professional with working knowledge and practical experience in own field. | Applies known concepts and methods to solve varied but related problems. | Contributes to projects within own area; accountable for quality and timeliness of assigned work. | May share knowledge and provide informal guidance to less experienced colleagues. |
| P3 | Professional roles | advanced professional | Works independently with minimal supervision; manages priorities and determines approaches to assignments. | Has a moderate to high impact on the success of own function or discipline through delivery of complex work. | Possesses in-depth knowledge in own discipline; acts as a resource or mentor for colleagues with less experience. | Handles complex assignments and adapts existing approaches to solve new challenges. | Leads components of larger projects or manages complete workstreams within own function. | May mentor others and provide functional guidance to small teams or project groups. |
| P4 | Professional roles | functional leader | Operates with high autonomy; defines objectives and priorities for own area of responsibility. | Directly influences the success of own function or business area through strategic decisions and leadership. | Has advanced knowledge of own discipline and solid understanding of related areas. | Leads initiatives that involve complex analysis, coordination, and problem-solving across multiple teams. | Responsible for significant projects or programs that support business objectives within a function. | Provides direction and leadership within a business area; may manage or coordinate professional teams. |
| P5 | Professional roles | top-tier expert | Operates independently with wide decision-making latitude; sets strategic direction in own domain. | Materially influences business outcomes and cross-departmental or global strategies. | Recognized authority with deep and specialized expertise; often serves as a company-wide or industry-level reference. | Handles the most complex, high-impact problems requiring original thinking and broad business understanding. | Shapes functional or enterprise-level initiatives with long-term implications. | Acts as a strategic advisor and thought leader; mentors senior professionals and influences organizational direction. |
| M1 | Manager roles | manager | Leads a small team or department with guidance from senior management; follows established policies and goals. | Accountable for the performance and results of a small team or sub-area within a function. | Experienced professional with strong understanding of operational processes and people management basics. | Manages day-to-day operations, coordinates resources, and resolves routine issues within own area. | Leads a team of support or professional staff to meet defined objectives and service levels. | Provides direct supervision, coaching, and performance feedback to team members. |
| M2 | Manager roles | senior manager | Operates with significant independence; sets team priorities in line with business strategy. | Accountable for the performance and results of a department or large team within own discipline or function. | Experienced manager with deep understanding of functional processes and interdependencies. | Oversees diverse activities requiring coordination of multiple teams or complex support functions. | Manages professional employees and/or supervisors; ensures achievement of operational and strategic objectives. | Leads and develops team leaders and professionals; fosters collaboration and continuous improvement. |
| M3 | Manager roles | director-level manager | Operates with broad discretion in decision-making; defines direction for multiple teams or departments. | Directly influences the success of a major function or business unit through leadership and strategic execution. | Strong business and functional knowledge; able to translate strategy into operational outcomes. | Leads complex programs or projects spanning multiple departments; integrates strategic and operational goals. | Responsible for multiple departments or functions; accountable for delivering long-term results. | Provides leadership to managers and senior professionals; shapes culture, priorities, and performance standards. |
| M4 | Manager roles | associate director | Operates with high autonomy; translates company strategy into plans across multiple teams or functions. | Drives results across a significant function or multiple departments with cross-functional influence. | Advanced business and functional expertise; strong ability to align execution with strategic goals. | Manages complex, cross-functional initiatives with competing priorities and dependencies. | Leads multiple teams or a major function; accountable for medium- to long-term objectives. | Leads managers and senior professionals; enables collaboration and consistent execution at scale. |
| M5 | Manager roles | senior director | Operates with enterprise-level autonomy; shapes strategic direction across major business areas. | Influences company-wide outcomes through strategic leadership and alignment of key priorities. | Broad and deep business expertise; strong strategic judgment and executive-level perspective. | Leads highly complex, multi-year initiatives with significant organizational and business impact. | Responsible for large functions or multiple business areas; accountable for long-term performance. | Provides senior leadership across the organization; sets vision, direction, and leadership standards. |
| E1 | Executive roles | senior executive | Operates with broad autonomy; defines strategy and priorities for major functions or business units. | Makes high-impact decisions that shape performance and direction within a significant part of the company. | Deep business and leadership expertise; recognized authority within own function or domain. | Oversees diverse and complex operations, integrating multiple functions and markets. | Responsible for achieving results across a major business unit or global function. | Provides leadership and direction through directors and senior directors; leads through multiple levels of management. |
| E2 | Executive roles | group executive | Operates with full strategic authority within assigned region or business group; minimal oversight. | Directly impacts company-wide outcomes through accountability for large-scale business performance. | Extensive experience leading major divisions or regions; deep understanding of enterprise dynamics. | Leads across multiple geographies or business lines with complex stakeholder and market environments. | Shapes and executes strategies for an entire business group or global region. | Provides leadership and direction to other executives, typically at the VP level; fosters alignment across divisions. |
| E3 | Executive roles | chief executive officer | Holds ultimate decision-making authority; defines the company's strategic vision, mission, and culture. | Responsible for the overall performance and long-term success of the organization. | Comprehensive business acumen and leadership capability spanning all company functions. | Leads a multifaceted global organization; balances strategic, operational, and governance priorities. | Sets enterprise-wide direction and ensures alignment with stakeholder and board expectations. | Leads the executive team and serves as the key representative to the board, investors, and external partners. |
Percentiles and penetration
A percentile shows where a salary sits within the market for that role: P10 means 10% of the market earns less, P50 (the median) is the market's midpoint, and P90 means only 10% of the market earns more. Percentile range penetration places an individual employee's own salary within their level's P25-P99 range, as a 0-100% position.
Compa-ratio
Compa-ratio compares an actual salary to a reference value: salary divided by that reference, times 100. A compa-ratio of 100 means the salary matches the reference exactly; below 100 is under it, above 100 is over it.
The platform uses two different references depending on where you see it: on Search Salaries, Insights and Benchmark Comparison, the reference is the market value at a target percentile (P50 by default). On Salary Bands, the reference is that employee's band midpoint instead — so the same employee can show a slightly different compa-ratio on each page, on purpose.
Reading band status
Every colored badge you see on an employee — on Employees, Insights and Salary Bands — comes from the same four-state band status:
The employee's salary is below the band minimum for their level.
The employee's salary falls within the band's minimum-maximum range.
The employee's salary is above the band maximum for their level.
There isn't enough market data for that position and level yet.
Salary basis
Gross is pay before taxes and employee social security. Net is what the employee actually takes home after those deductions. Company cost adds the employer's own social security and other mandatory contributions on top of gross — it's what the role actually costs the company. Contractor shows an equivalent hourly/day rate for non-payroll engagements. Switching basis changes the numbers you see everywhere without changing the underlying market data.
Employees and contractors
Every person on your Employees page has a worker type: Employee or Contractor. It decides what the amount you enter means and what it gets compared against. For an employee, the salary is an annual amount benchmarked against market salaries. For a contractor, the same field holds an hourly rate benchmarked against the market contractor rate for that position, location, and level. Every new person is an Employee unless you say otherwise, so nothing changes for a company that never adds a contractor.
Adding a contractor
The Add employee and Edit forms have a Worker type selector. Switching it to Contractor reshapes the form around how contractors are actually paid:
- Salary becomes Hourly rate, with a /h suffix next to the currency. Decimals are kept exactly as typed, so a rate of 62,50 stays 62,50 instead of being rounded to 62.
- Number of Pays, Bonus, and Stock disappear, since a contractor has no pay schedule and no equity plan. Anything those fields held is discarded when you save.
- Employment Type and Hours per week stay, so you can still record a part-time engagement.
Example
Employee
Worker type
Salary
Number of Pays
Bonus
Stock
Contractor
Worker type
Enter the hourly rate. Contractors are compared against the market contractor rate, not against employee salaries, and are left out of pay gap reports.
Hourly rate
How a contractor is benchmarked
TalentUp doesn't compare an hourly rate to an annual salary. It converts the market data instead, using the same rule Search Salaries, Benchmark Comparison, and salary certificates already apply when you choose the Contractor salary basis: market hourly rate = annual gross market salary × 2 ÷ 2,080. The 2,080 is a standard full-time year (52 weeks of 40 hours), and the factor of 2 reflects that a contractor's rate has to cover what an employer would otherwise pay on top of salary: social security, paid leave, benefits, and the gaps between engagements.
Every percentile is converted the same way (P10 through P99), so the contractor's percentile, compa-ratio, market salary, and market-position badge are all hourly against hourly. A contractor at 62,50 EUR/h against a market P50 of 57,69 EUR/h has a compa-ratio of 108 and shows In market, exactly as an employee would against their annual numbers. The contractor's own Hours per week don't change the market rate: the benchmark is always the full-time equivalent rate.
Example
Market salary, annual gross (P50)
60.000 EUR
Backend Engineer · Madrid · Senior
Market contractor rate (P50)
57,69 EUR/h
The same conversion is applied to every percentile
| P10 | P25 | P50 | P75 | P90 | |
|---|---|---|---|---|---|
| Annual (EUR) | 42.000 | 50.000 | 60.000 | 72.000 | 85.000 |
| Contractor (EUR/h) | 40,38 | 48,08 | 57,69 | 69,23 | 81,73 |
Contractor's hourly rate
62,50 EUR/h
Percentile
P60
Compa-ratio
108
Where contractors show up
- Employees: a small gray Contractor badge next to the name, and every amount in the row (rate and market range) carries /h. The employee profile shows Hourly rate instead of Annual total compensation, with a Contractor chip in place of the number of pays.
- Filters: as soon as your company has at least one contractor, the filter sidebar gains a Worker type group with Employee and Contractor chips, on Employees and on the team's Assign employees screen. Companies without contractors never see it.
- Salary Bands: contractors get their own All contractors tab, with bands built from the hourly market rate, an hourly axis, and settings saved separately from the employee bands. All employees no longer includes them.
- Excel: the import template and the bulk-edit spreadsheet have a Worker type column (employee or contractor), and the Employees export adds the same column, so you can tell which Salary and Band figures in the file are hourly.
Why contractors are left out of pay equity
Contractors are deliberately excluded from every pay equity calculation: mean and median pay, the gender pay gap and pay gap per level, variable pay by gender, the justified pay gap in Pay gap insights, the average compa-ratio, the tenure charts, and the cohort comparison behind the Unequal pay flag. Mixing hourly rates into those numbers would make them meaningless, and it would also be wrong in substance: the EU Pay Transparency Directive covers workers with an employment contract or relationship, so the gap figures you report on should describe your employees. Contractors still get their own individual market benchmark and band status, so you can check whether you're paying them fairly against the contractor market without distorting your gap reporting.
Contractors are benchmarked individually
- Percentile, compa-ratio and market-position badge, against the market contractor rate
- Their own All contractors tab on Salary Bands
- Below-market pay and Missing data labels
- Worker type column in Excel import, bulk edit and export
Left out, employees only
- Pay statistics (mean and median pay)
- Gender pay gap, pay gap per level and variable pay by gender
- Pay gap insights
- Average compa-ratio and tenure charts on Insights
- Unequal pay comparisons
- My Compensation statement (PDF)
Setting the worker type in bulk
In the Excel template, the Worker type column accepts employee or contractor, and also common variants like freelance, freelancer, external, self-employed, or autónomo, which all count as contractor. On a first import an empty cell means Employee. In Edit employees, an empty cell keeps whatever type that person already has, so re-uploading an old spreadsheet can never quietly turn a contractor back into an employee; a changed type appears in the review page as its own Worker type change before you apply it.
From an HRIS, Personio sets the type for you: anyone whose employment type is External in Personio is imported as a contractor. Later syncs only ever move someone toward contractor, never back, so a contractor you set by hand stays one. People imported from HiBob or AlexisHR arrive as employees; change the type from their profile's Edit form when needed.
Peer groups
A peer group is a named list of at least 5 companies you choose to benchmark against instead of the whole market — your closest competitors, for example. Once saved, you can select it as a filter on Search Salaries or as your company's default comparison set.
Frequently asked questions
Yes. Add them on the Employees page with Worker type set to Contractor and enter their hourly rate. TalentUp converts the market salary for their position, location, and level into a market contractor rate (the annual gross salary multiplied by 2 and divided by 2,080) and compares the two, so they get a percentile, a compa-ratio, and a band status like everyone else. They are kept out of pay gap and pay equity figures, which only describe employees.