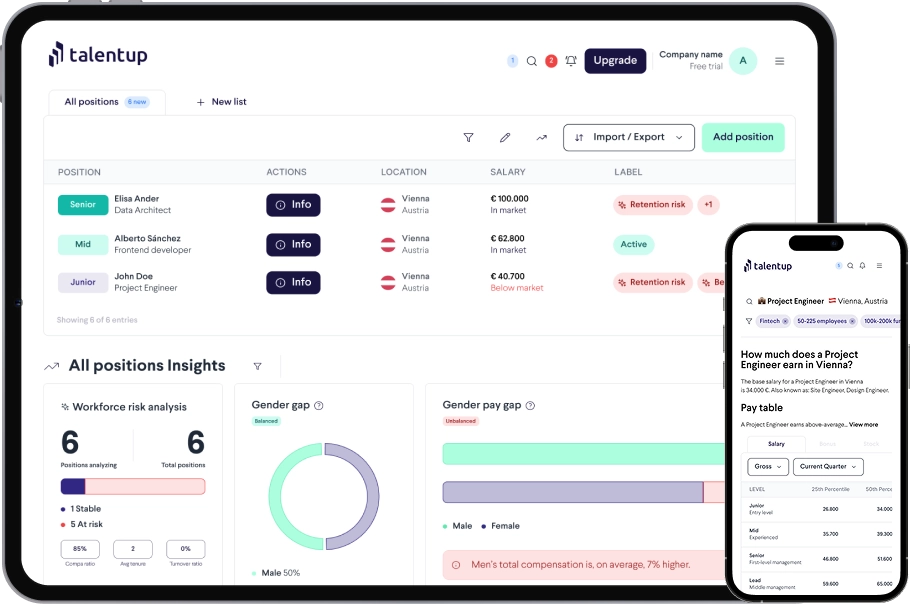
The Market Salary Search is TalentUp’s core benchmarking tool. It gives you the current market salary for any job role in any location, filtered to match your company’s specific profile. Use it when setting a salary for a new hire, preparing a compensation offer, validating your pay ranges, or exploring what different markets pay for roles you are planning to hire.
How to Perform a Search
Fill in two required fields in the search panel on the left:
Click Search to generate the benchmark report.
Refining Your Search with Filters
The Filters panel below the search button narrows the benchmark to companies that match your organization’s profile. These are pre-populated from your Company Settings but can be adjusted for any individual search. Changing filters here does not affect your global Company Settings.
Click Apply after adjusting filters to refresh the results. Well-configured filters are important: they ensure you are comparing against companies your candidates actually consider, not the entire market.
Reading the Benchmark Result
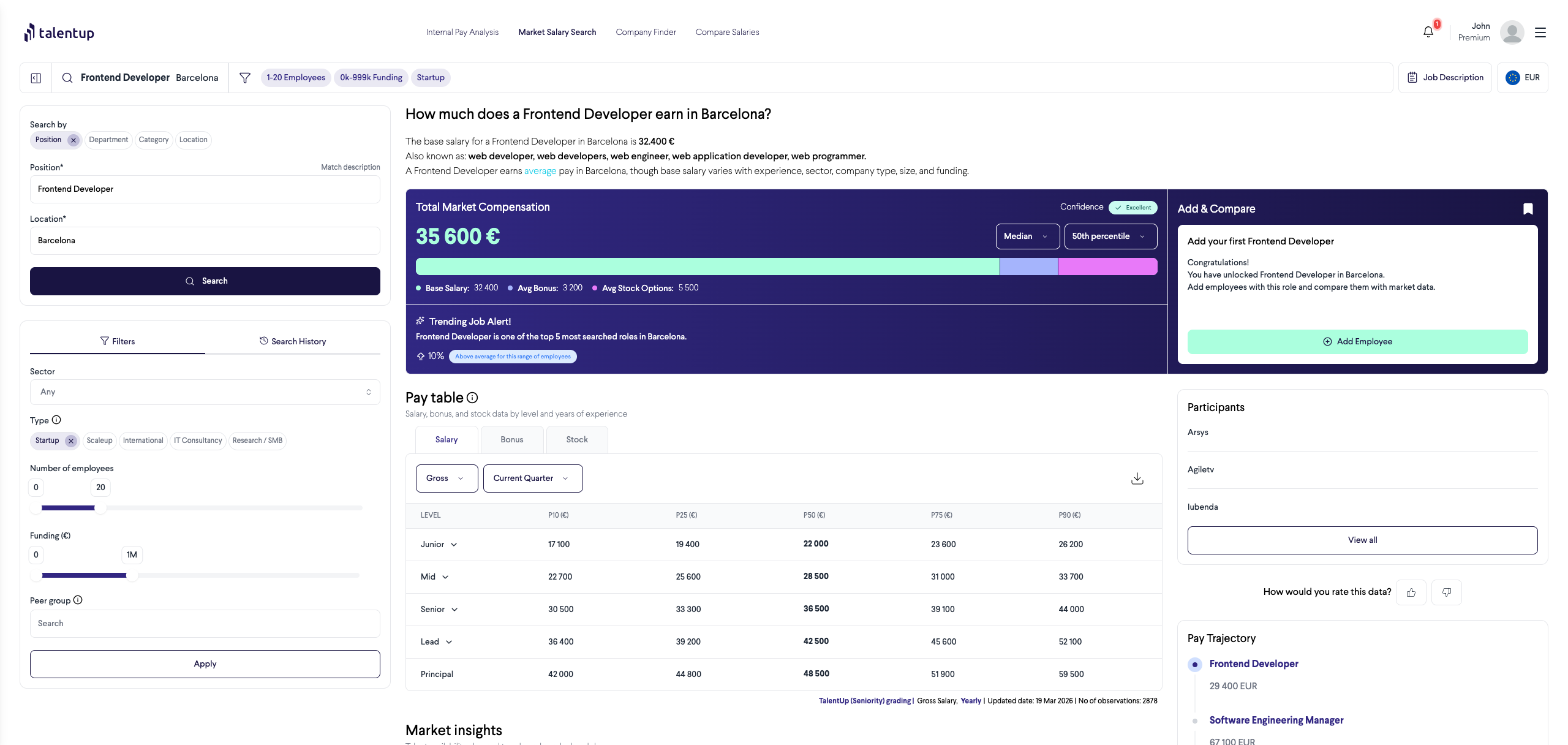
The right-hand panel shows the full benchmark report once your search is complete. Each section gives you a different perspective on the data:
Total Market Compensation
The headline figure is the current market salary for the role and location at the selected percentile. Use the controls to adjust what you see:
The bar below the headline shows the split between Base Salary and Average Stock Options, giving you a view of total compensation rather than just cash.
Market Balance Indicator
This label reflects current talent supply and demand for the role in this location:
Pay Table by Level
A breakdown of salary ranges across seniority levels (Junior, Mid, Senior, Lead) at P10, P25, P50, P75, and P90. Toggle between:
Market Insights
Supply and demand metrics and sector comparisons that give you context on how competitive the hiring environment is for this role. Useful when deciding how aggressively to position your salary offer.
Pay Trajectory
A forward-looking view of how salaries for this role are expected to evolve based on market trends. Use this when planning compensation budgets for the year ahead or forecasting the cost of a new hire over time.
Add & Compare
From any benchmark result you can click Add Employee to add this position directly to your Internal Pay Analysis roster, so you do not have to re-enter data manually when you switch between tools.
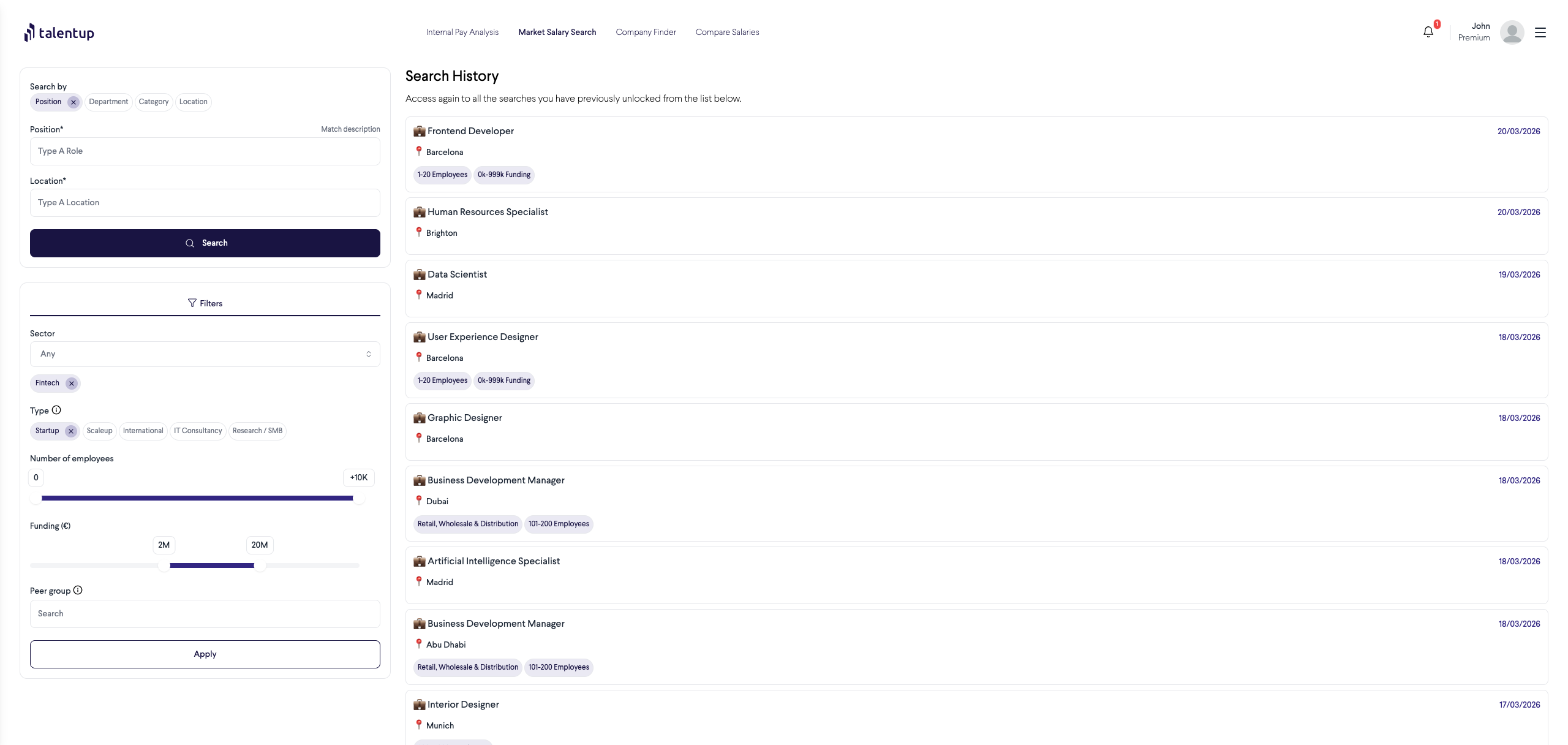
Search History
Every benchmark you unlock is saved in your Search History, visible in the right-hand panel when no search is active. Click any entry to reload that benchmark instantly. Each history item shows the role, location, active filters, and the date of the search.
Note: unlocking a benchmark consumes credits. Benchmarks already in your search history can be reviewed at any time at no additional cost.
Searching by Department or Category
The Search by tabs at the top of the search panel let you switch from searching by Position (the default) to broader groupings: