The Internal Pay Analysis is where you bring your own employee data into TalentUp and see, role by role, how your team’s compensation compares to the live market. It gives HR teams a clear view of salary fairness, pay equity risks, and retention exposure, and produces the analytics needed for compensation reviews, pay transparency reports, and leadership briefings.
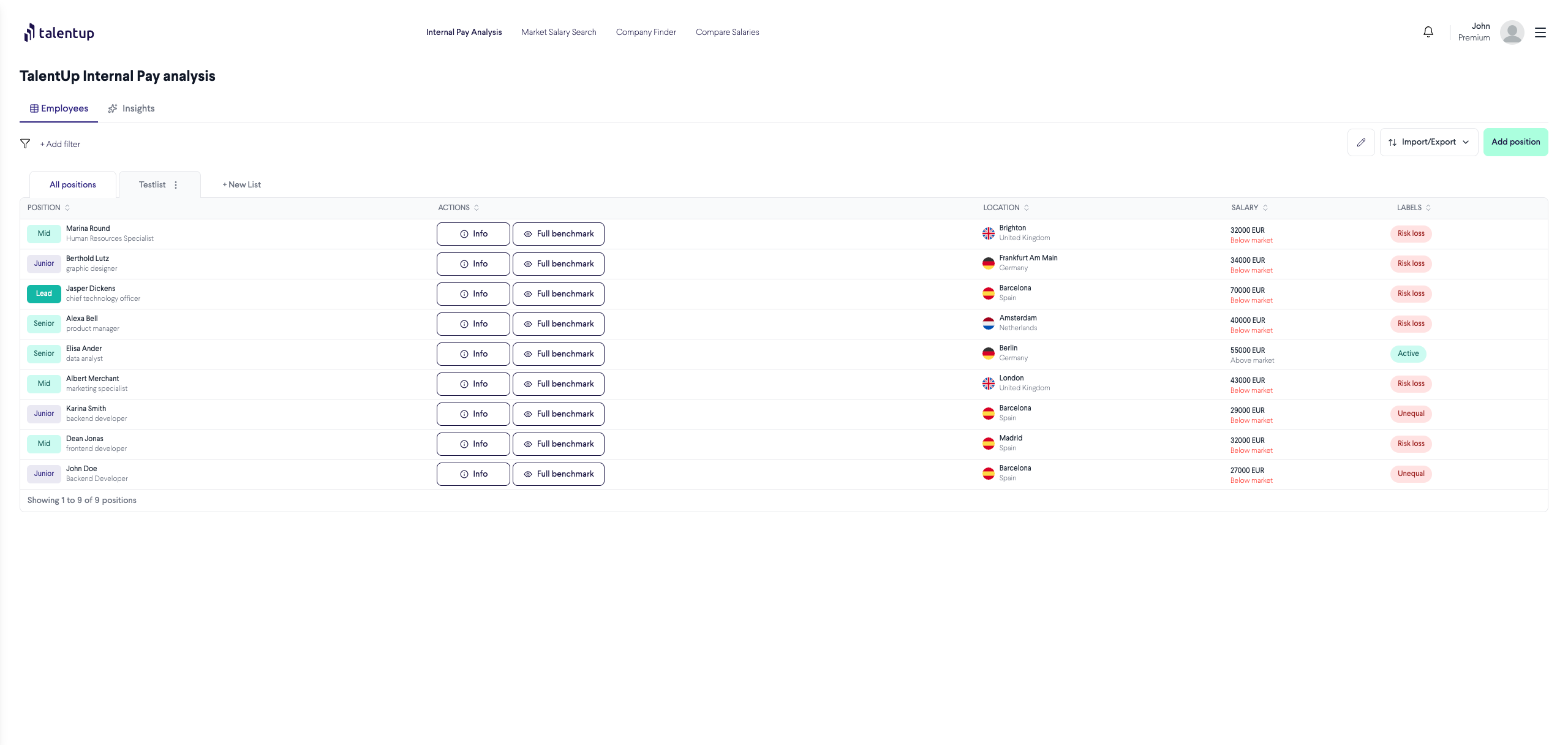
The Employees tab lists all positions with their salary, location, and market benchmark status at a glance.
What You Can Do with Internal Pay Analysis
Upload and manage employee salary data: add positions manually or via bulk import, and export the list at any time for reporting
Benchmark each position against the live market: see instantly whether each employee’s salary is below, at, or above the market median for their role and location
Filter and segment your workforce: slice data by role, seniority level, department, location, salary range, and benchmark label
Identify compensation risks before they become turnover: spot underpaid employees flagged as “Risk loss”, pay equity concerns flagged as “Unequal”, and well-compensated staff flagged as “Active”
Create custom lists: organize positions into named groups for easier tracking across departments or review cycles
The Employees Tab
The Employees tab is the main workspace. Each row represents one position and displays:
Quick salary summary (Info) or full market report (Full benchmark)
Understanding the Labels
Risk loss: the employee’s salary is significantly below market. There is a material risk they may leave for a better-paying opportunity. Prioritize these for your next review cycle.
Active: the employee’s compensation is competitive and well aligned with the market.
Unequal: there may be a pay equity concern, such as a meaningful disparity compared to peers in similar roles at the same level.
Filtering Your Data
Use Add filter at the top of the Employees tab to narrow your list. Available filters include Name, Position, Department, Seniority, Salary Range, Location, and Label. Combine filters to create precise segments, for example, all “Risk loss” employees in your Engineering department above Senior level.
Managing Lists
Use New List to create named groups of positions such as “Engineering Team” or “2025 Review Cycle”. This helps you work through large organizations in focused segments and keep different review processes separate. The default “All positions” view always shows your complete workforce.
Import / Export
Use the Import/Export button (top right) to bulk upload employee data via a CSV or Excel template, or to export your current list for external reporting. This is the fastest way to get started when onboarding the platform for the first time or refreshing data after a compensation review.
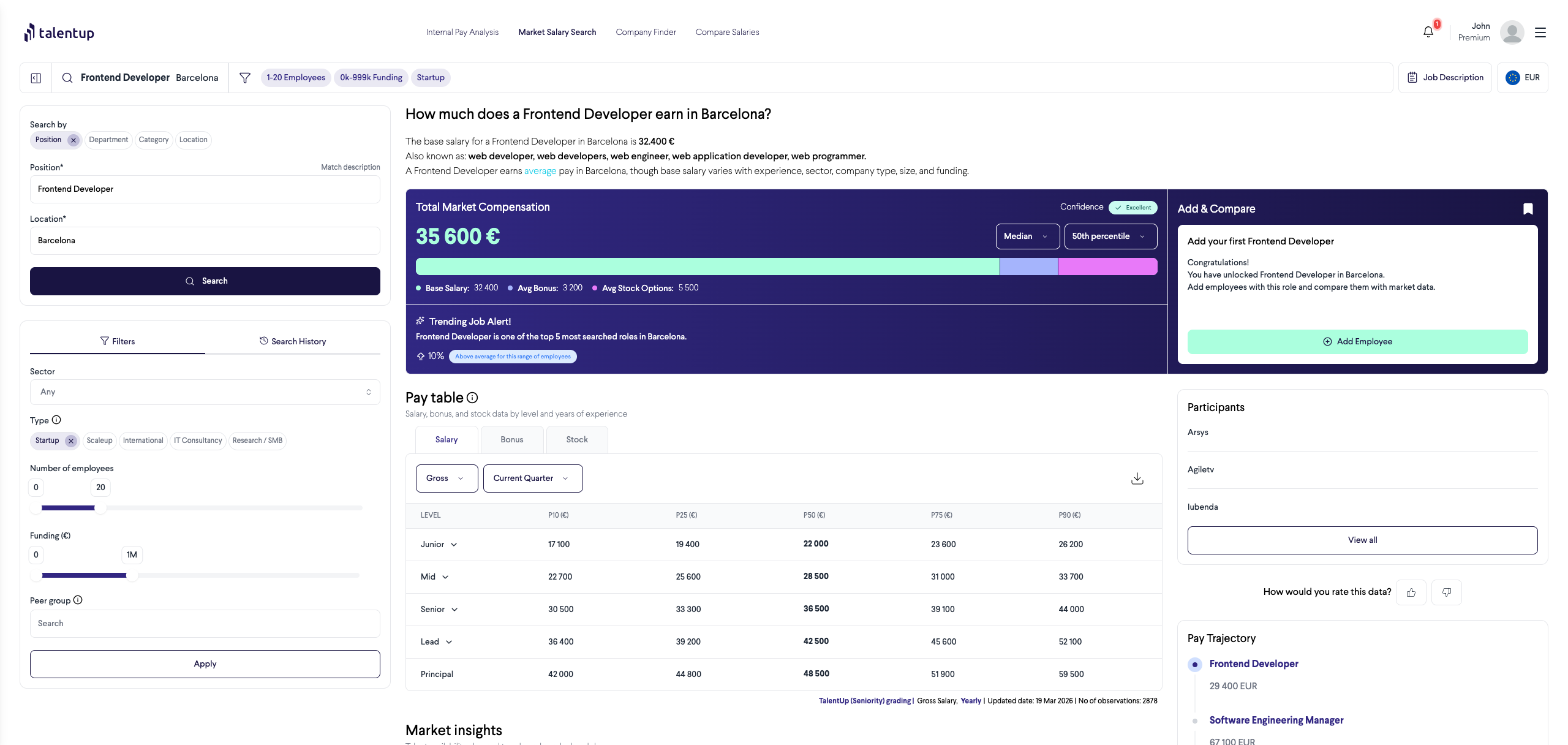
Full Benchmark: Deep Dive into Any Position
Clicking Full benchmark on any employee row opens a detailed market salary report for that specific role and location, powered by TalentUp’s live salary database.
The Full Benchmark report shows total market compensation, salary ranges by level, and supply and demand insights for any position and location.
The report includes:
Total Market Compensation: the market salary for the role at the selected percentile (P10 to P90), with base salary and average stock options shown separately
Market Balance Indicator: whether the talent market for this role is balanced, in short supply, or oversupplied in the selected location
Pay Table by Level: salary ranges (P10 to P90) for Junior, Mid, Senior, and Lead, with Gross/Net toggle and currency selection
Market Insights: trends in talent availability, demand, and sector comparisons
Pay Trajectory: how compensation for this role is expected to evolve over time
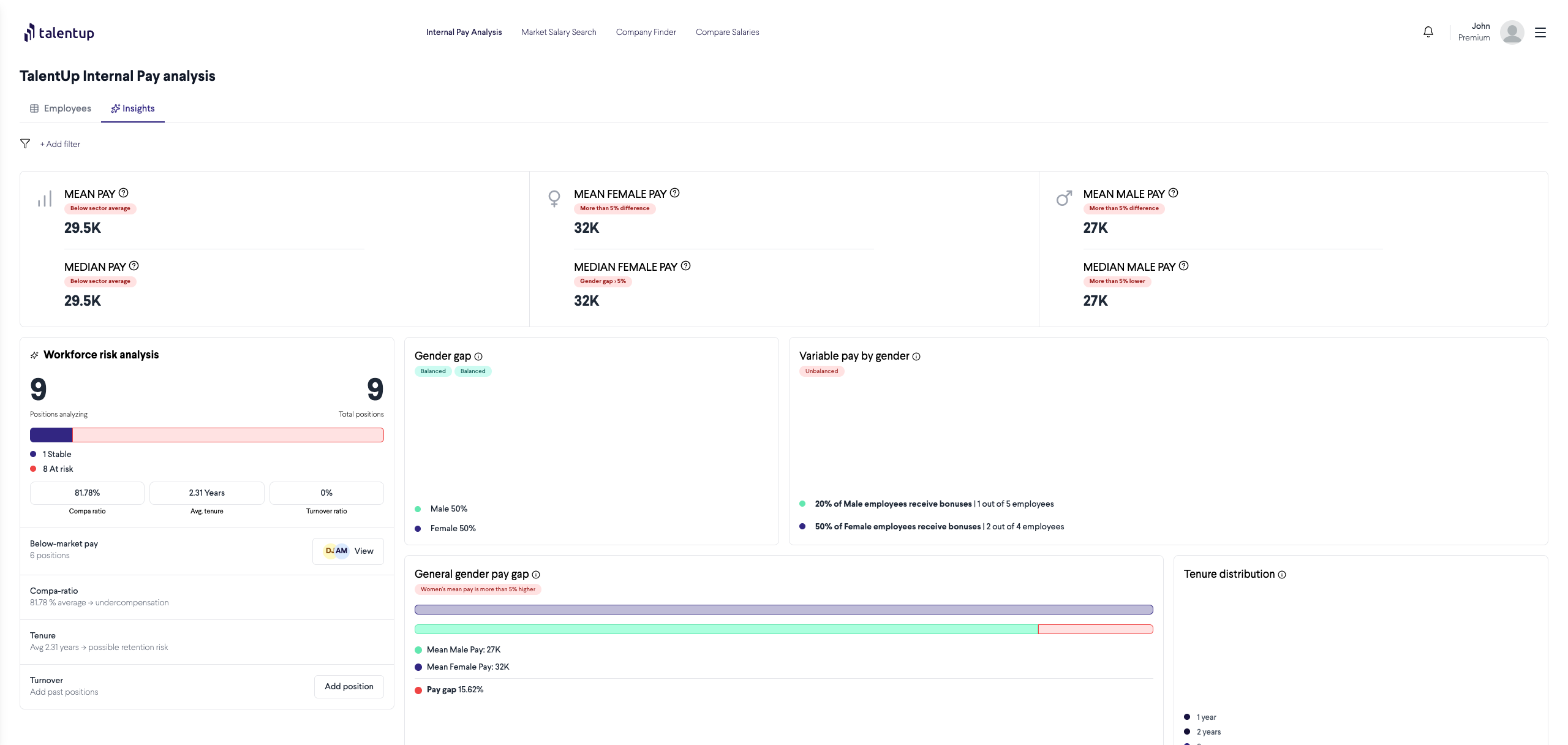
The Insights Tab: Workforce Analytics at a Glance
The Insights tab provides an aggregate, visual view of your entire workforce’s compensation health. It is designed to surface pay equity concerns and market positioning data in a format suitable for leadership reviews and compliance reporting.
The Insights tab: a compensation analytics dashboard covering pay equity, gender gap, workforce risk, and tenure distribution.
Key Metrics Displayed
Mean and Median Pay: overall average pay broken down by gender. Flags whether your company’s average is below or above the sector average.
Workforce Risk Analysis: shows the ratio of stable versus at-risk positions, your team’s average Compa Ratio, average tenure, and turnover ratio. Also highlights the number of below-market positions directly.
Gender Gap: a visual breakdown of your workforce gender balance and whether it meets a “Balanced” threshold.
Variable Pay by Gender: the proportion of male versus female employees receiving bonuses, making bonus equity issues immediately visible.
General Gender Pay Gap: a bar chart comparing mean pay by gender with the calculated pay gap percentage.
Pay Gap per Level (Quartiles): breaks down the pay gap by organizational quartile (Q1 to Q4), showing gender pay disparity at each level of the organization.
Tenure Distribution: a breakdown of how long employees have been with the company, useful for understanding compensation against retention.
The Insights tab is particularly useful when preparing reports for Pay Transparency audits, board-level compensation reviews, or any DEI reporting obligation. Use it alongside the Employees tab to move from aggregate findings down to individual cases.
Understanding the Compa Ratio
The Compa Ratio (Compensation Ratio) shows how an employee’s salary compares to the current market median for their specific role and location:
Compa Ratio = Employee Salary / Market Median Salary
1.00: salary is exactly at the market median
Below 1.00: salary is below market; the lower the ratio, the higher the retention risk
Above 1.00: salary is above market; strong for retention but worth reviewing against budget targets
A team average Compa Ratio of 0.82, for example, means your employees are paid on average 18% below market. That is a strong signal to act before turnover rates start to climb.
Common Use Cases
Annual Compensation Review: upload your full employee list and use the benchmark labels to identify who needs a salary adjustment and by how much
Retention Risk Identification: filter by the “Risk loss” label to focus immediately on the employees most likely to leave due to below-market pay
Pay Equity Audit: use the Insights tab to detect and document gender pay gaps, bonus disparities, and quartile imbalances for internal or external reporting
EU Pay Transparency Compliance: generate the data required under the EU Pay Transparency Directive, including gender pay gap calculations and Compa Ratio breakdowns by level
New Hire Calibration: before making an offer, use Full Benchmark to confirm your proposed salary is competitive for the role and location
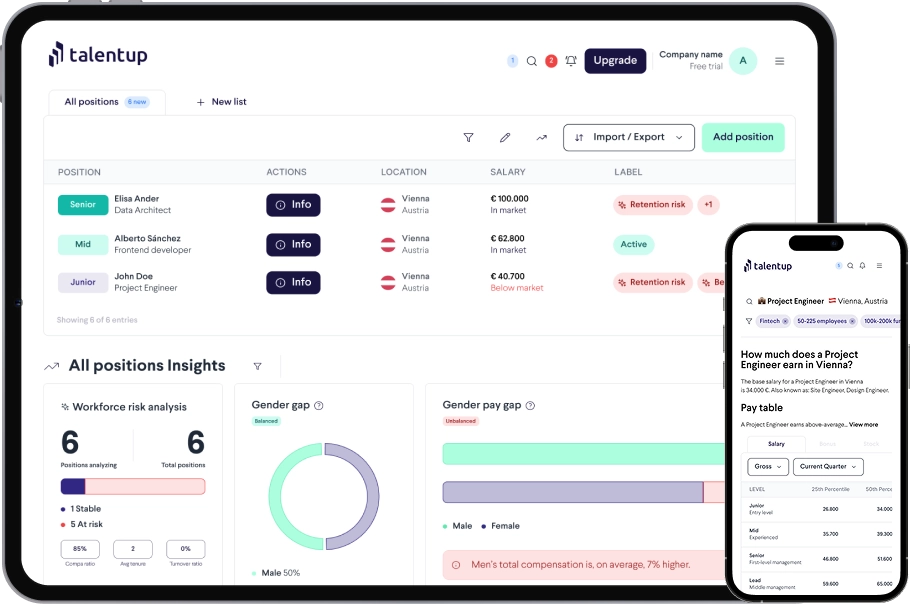
World’s leading Salary Benchmarking Solution
TalentUp helps companies handle salaries effectively by offering clear, compliant, and data-based information that allows teams to create successful pay strategies and follow transparency rules.