The Market Salary Search feature is the starting point for exploring real-time, market-aligned compensation insights on TalentUp. Designed for HR professionals, recruiters, and compensation analysts, this tool enables you to quickly access and compare salary data for any role in any location—across industries and company types. Whether you’re preparing an offer, running an internal salary audit, or benchmarking compensation strategy, this feature provides you with access to TalentUp’s extensive market intelligence—based on millions of validated data points.
What You Can Do with the “Market Salary Search” Feature
- Search by job title or job description
- Analyze gross, net, company cost, or contractor salary
- Filter results by company size, funding, sector, and type
- View market salary distribution by seniority
- Explore variable compensation, supply and demand, gender gap, and benefits
How to Perform a Salary Search
The Market Salary Search feature allows users to research and analyze salaries for specific roles in a chosen location. It provides not only the average salary but also a complete breakdown of total compensation, market dynamics, and benefits. Below is a detailed explanation of how to perform a search and how to read each part of the results page.
Step 1: Perform a Search
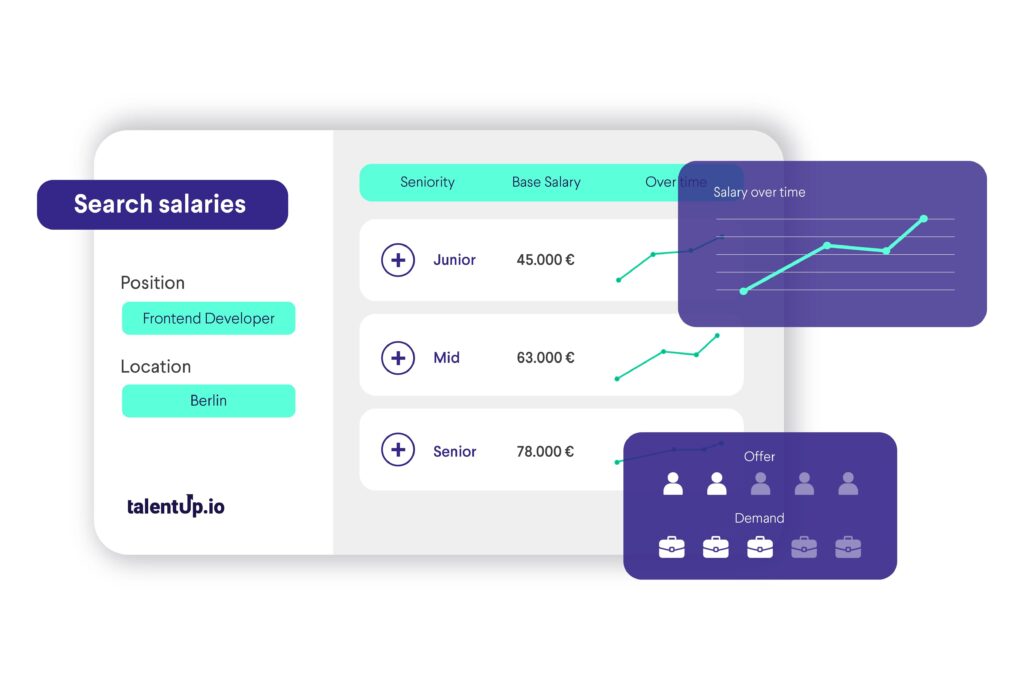
At the top left of the page, you will find the search bar. Here you can enter the job title you want to investigate. For example, typing “Data Scientist” will display information about salaries for that role. Next, enter the location in the second search box. In this case, “Berlin” is used as an example.
[IMG1]https://talentup.io/apidocumentation/wp-content/uploads/2025/04/Captura-de-pantalla-2025-11-07-a-las-13.39.17.png[IMG2]

Once both fields are completed, click on the Search button. The platform will then generate a detailed salary report for that role and location.
Additionally, there are filters available below the search bar to refine the results further. It is especially important to narrow the search to the specific industry you are recruiting talent for, as compensation levels can vary widely between fields.
You should always align the filters with the types of companies where the talent currently works or with those where you are competing for talent. For instance, even if you are a startup but are looking for talent from larger companies, you should adapt the filters to reflect those organizations rather than your own.
These filters include:
- Sector: Allows you to specify the industry or field (e.g., IT, healthcare, finance). Salaries can differ significantly depending on the sector.
- Type: This function lets users select their company type (Startup, Scaleup, International, IT Consultancy, or Research/SMB) to refine and personalize salary data. Choosing the correct type ensures more accurate and context-specific compensation insights.
- Number of employees: Refers to the number of employees in the organization.
- Funding: Useful when analyzing startups. It shows whether the company is early-stage with limited budgets or well-funded with greater resources to pay higher salaries.
- Peer group: Lets you compare specific sets of companies or competitors against each other.
Applying these filters helps narrow down the data to more relevant results tailored to the specific situation you are analyzing.
Step 2: Reviewing the Main Salary Results
Once the search is complete, the right side of the page displays the main salary summary. This is the most prominent information and is intended to give a quick but comprehensive overview of how much professionals in the selected role and location earn.
[IMG1]https://talentup.io/apidocumentation/wp-content/uploads/2025/04/Captura-de-pantalla-2025-11-07-a-las-13.56.55.png[IMG2]

The first number to focus on is the Total Market Compensation. This combines three elements:
- Base Salary: The fixed annual pay without bonuses or additional incentives.
- Average Bonus: Variable pay that employees may receive based on performance, company results, or individual agreements.
- Average Stock Options: The average value of equity compensation offered by companies, more common in startups and tech firms.
Together, these three elements show the full earning potential. For example, in the screenshot, the base salary is 46,600 €, the average bonus is 4,500 €, and the average stock options value is 7,600 €, resulting in a total market compensation package of 51,100 €.
Alongside this breakdown, the system provides a Confidence score. This value indicates how reliable the data is, based on the quantity and quality of available information. In this case, the confidence level is marked as “Excellent,” which means the figures are based on solid and sufficient market data.
Finally, there is a Market Competition indicator. This shows how difficult it is to secure jobs for this role in the given location. It explains whether there are more candidates than available jobs (which drives competition up and salaries down) or if demand is higher than supply (which benefits job seekers). In the example, competition is considered a “Balanced Market” .
Step 3: Exploring the Pay Table
The pay table provides a more detailed look at salary distribution across different percentiles or experience levels. Instead of showing just an average, it highlights how salaries are spread out in the market.
[IMG1]https://talentup.io/apidocumentation/wp-content/uploads/2025/04/Captura-de-pantalla-2025-11-21-a-las-13.24.10.png[IMG2]
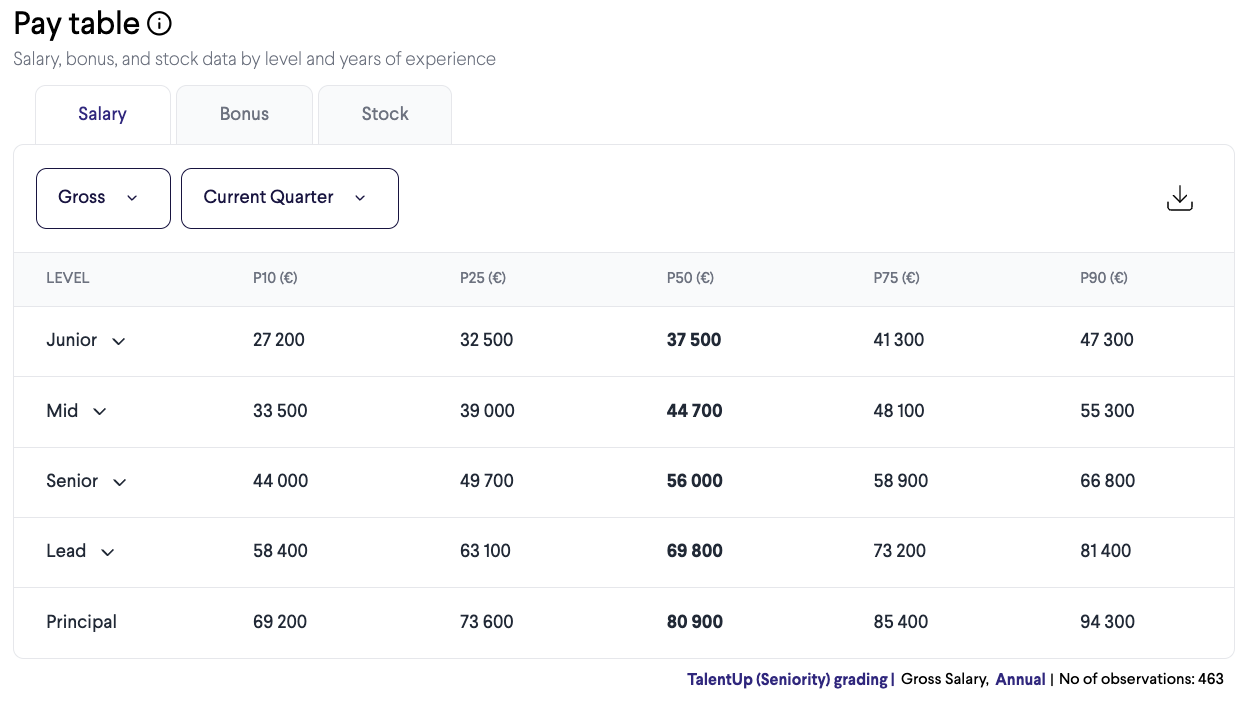
The percentiles are usually represented as follows:
- P10: The 10th percentile. Salaries at this level represent entry-level or the lowest-paid professionals in the role.
- P25: The 25th percentile. This typically represents junior professionals with some experience.
- P50 (Median): The 50th percentile. This is the middle point, meaning half of the professionals earn less and half earn more.
- P75: The 75th percentile. Represents more experienced professionals, often at mid-to-senior levels.
- P90: The 90th percentile. Salaries at this level usually correspond to senior or highly specialized professionals at the top of the pay range.
This section allows you to see how much progression is possible in terms of pay as you gain experience or move into higher levels of responsibility.
[IMG1]https://talentup.io/apidocumentation/wp-content/uploads/2025/04/Captura-de-pantalla-2025-11-21-a-las-13.24.23-1.png[IMG2]

In the pay table, you can switch between different grading frameworks (TalentUp Seniority, TalentUp Levels, Gradar, Korn Ferry, Mercer, Radford, WTW Career Level, WTW Global Grade).
These frameworks are essentially job-leveling systems used by companies to benchmark roles and compare compensation fairly across the market.
When you select a grading system in the menu (e.g., TalentUp Seniority or Korn Ferry), the pay table restructures the data according to that framework’s job levels.
This means the salary percentiles (P10, P25, P50, P75, P90) you see will correspond to the levels defined by that specific system.
Benefits of choosing a grading system
1. More accurate benchmarking
Different companies use different leveling systems. Selecting the one that matches your organization (or the one you want to compare with) gives you a far more accurate compensation benchmark.
2. Apples-to-apples comparisons
Instead of guessing whether “Senior” in one framework equals “Level 4” in another, you simply switch grading systems and see salaries aligned exactly with that structure.
3. Better internal alignment
If your company uses Korn Ferry, WTW, or Mercer grades, setting it as default ensures your team always sees compensation data in your internal language.
4. Easier external comparisons
For candidates, recruiters, or HR teams working across multiple companies, switching gradings helps compare roles that use different terminology.
5. Flexibility and customization
You can select a system temporarily or set one as the default to keep the table aligned with your preferred framework.
Gross Tab
[IMG1]https://talentup.io/apidocumentation/wp-content/uploads/2025/04/Gross.png[IMG2]
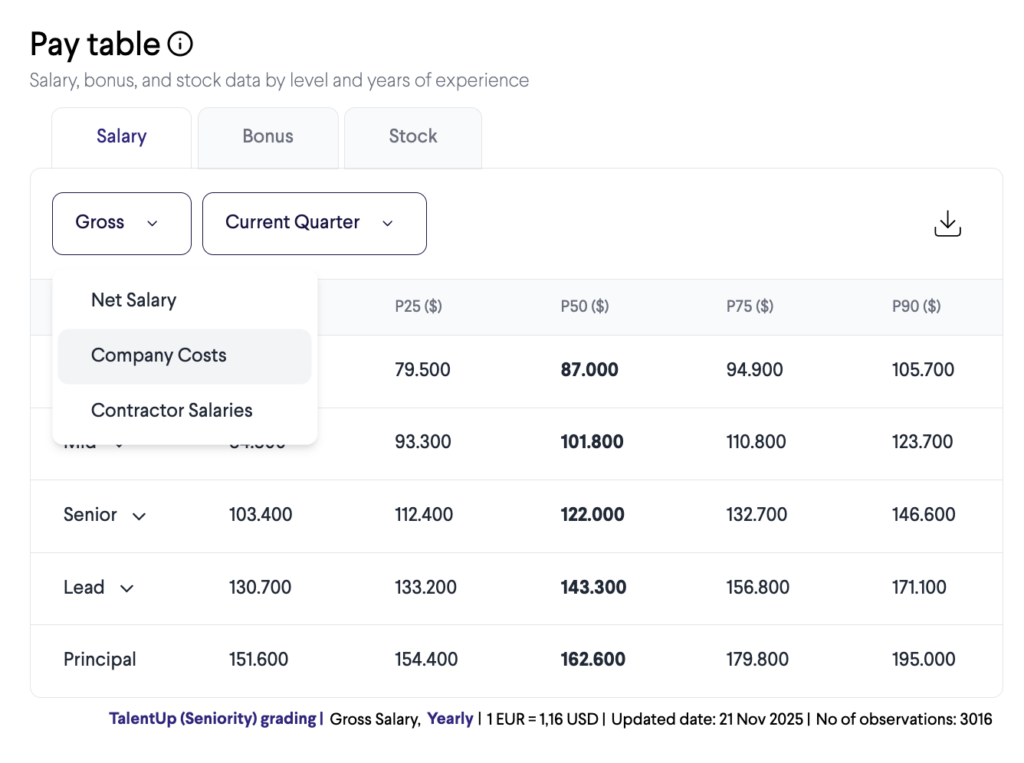
Selecting Gross opens the Gross Tab, which provides access to all salary-related view options. Within this tab, users can switch between:
- Gross Salary: Displays total earnings before any deductions.
- Net Salary: Shows take-home pay after all applicable deductions and withholdings.
- Company Costs: Presents the employer’s full cost, including gross salary plus employer contributions and taxes.
- Contractor Salaries: Displays compensation structures specific to contractors, reflecting invoicing models and contractor cost components.
The Gross Tab acts as the central hub for comparing salary perspectives across different employment types and cost layers.
Current Quarter Tab
[IMG1]https://talentup.io/apidocumentation/wp-content/uploads/2025/04/Current-Quarter.png[IMG2]
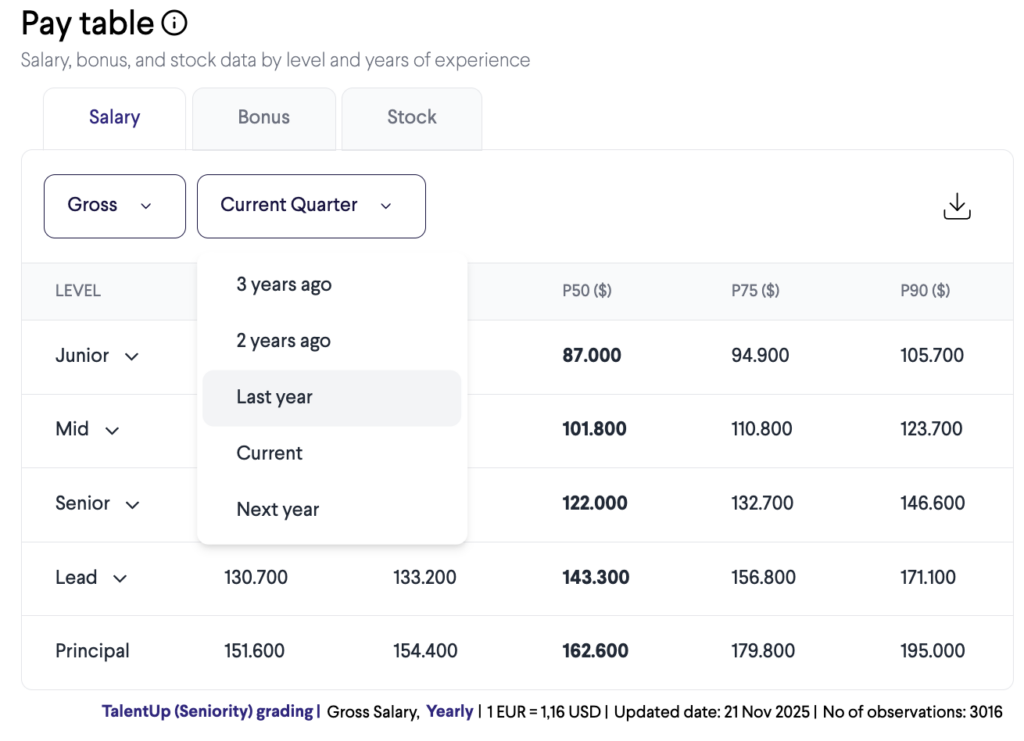
Clicking Current Quarter opens the Current Quarter Tab, which provides the available time-period filters used to adjust the salary data. The options include:
- Current Quarter: Data associated with the present reporting quarter.
- 3 Years Ago: Historical salary and cost data from three years prior.
- 2 Years Ago: Historical data from two years prior.
- Last Year: The complete previous year’s salary results.
- Current: Data associated with the present reporting year.
- Next Year: Forward-looking salary projections or planned compensation values for the upcoming year.
The Current Quarter Tab enables users to easily navigate across historical, current, and forecasted periods when reviewing salary information.
Bonus
Bonus amounts remain flat within a given pay grade. Position | Location | Level | Experience grouping because, within the platform, bonuses are defined by job level (e.g., junior, mid, senior) rather than by years of experience. The available data does not provide sufficient detail to model bonus progression by experience, so all employees within the same level are assigned the same bonus benchmark regardless of tenure.
Flat bonus values across multiple percentiles are typically the result of strong clustering in the underlying data. When a large proportion of employees receive the same bonus amount, multiple percentiles can fall on that same value.
This effect is more pronounced in smaller datasets, where percentile calculations are less granular. With fewer observations, several percentile thresholds may map to a single data point, resulting in identical values across P10, P25, and P50. This contrasts with roles such as Interior Designer, where greater variability in reported bonuses allows for clearer differentiation across percentiles.
Identical values across lower percentiles therefore do not indicate an error but rather reflect limited variability or concentration of bonus values within a given role and level.
Blank or “–” entries indicate that no bonus was reported. This is most commonly observed in junior-level positions, where bonuses are typically not paid.
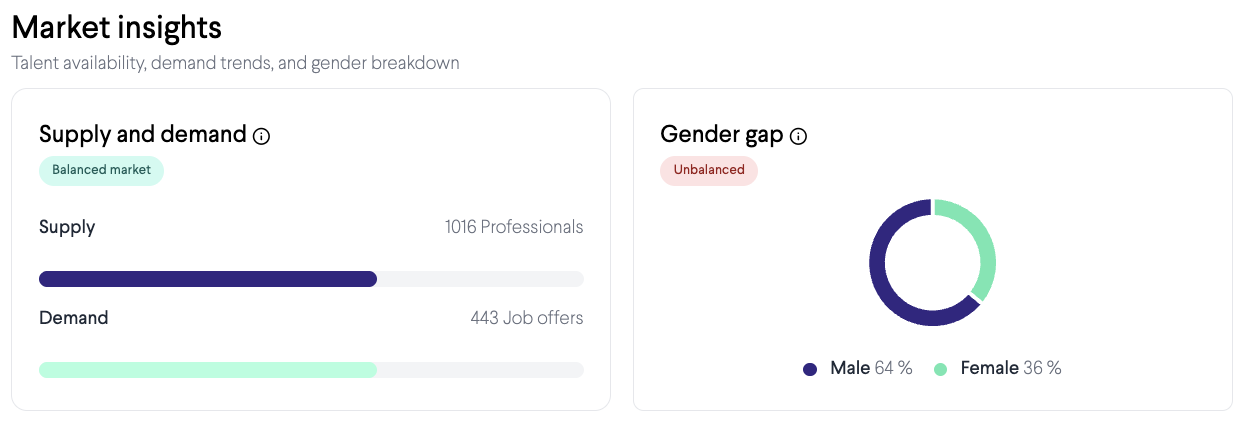
Step 4: Market Insights
[IMG1]https://talentup.io/apidocumentation/wp-content/uploads/2025/04/Captura-de-pantalla-2025-11-21-a-las-13.51.09.png[IMG2]
The Market Insights section provides context about the balance between supply and demand in the labor market for the selected role and location.
- Supply shows the number of professionals available in the market.
- Demand shows the number of open job offers for that role.
If supply is higher than demand, competition for jobs is strong, and salaries may stagnate or even decrease. If demand is higher than supply, companies need to compete to attract candidates, which generally leads to better salaries and benefits for professionals.
In addition, this section often contains a Gender Gap analysis. It displays the percentage of male and female professionals in the role and may show salary differences between genders. This helps organizations and professionals understand diversity dynamics and whether there are disparities in compensation.
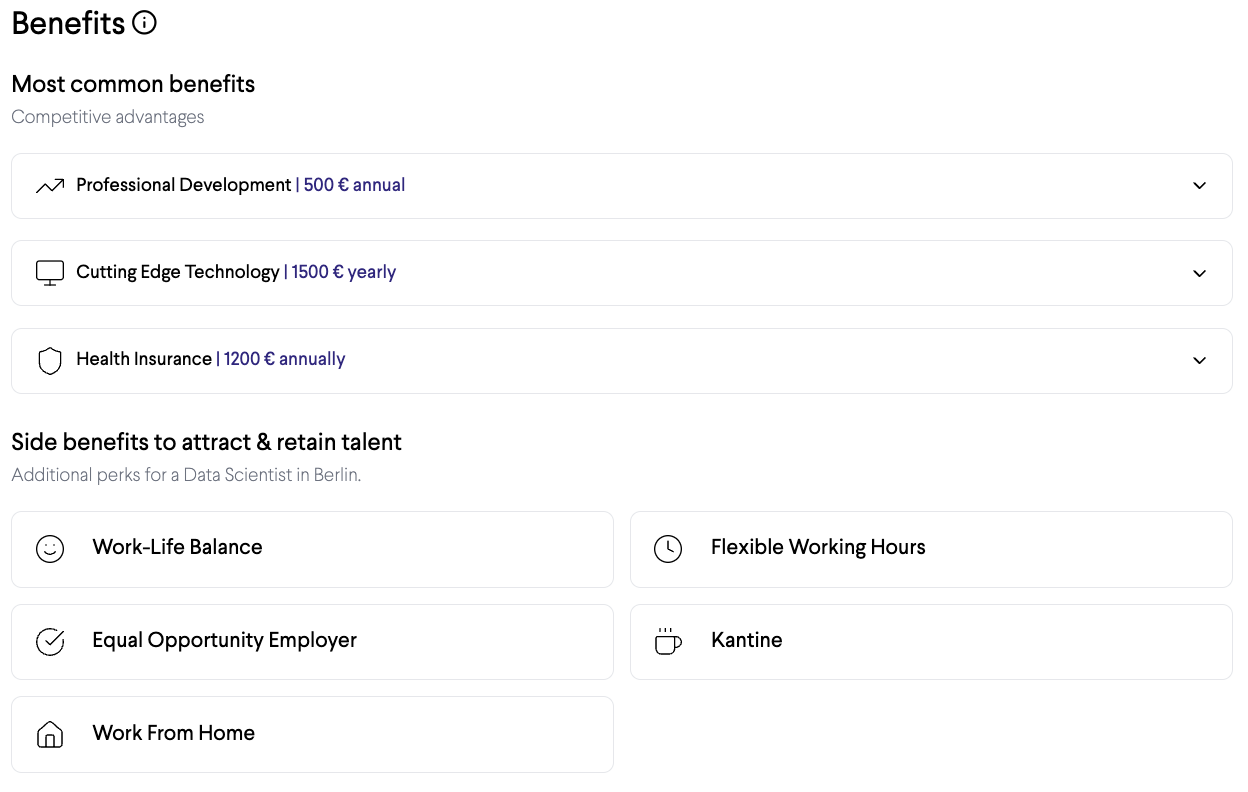
Step 5: Benefits Information
[IMG1]https://talentup.io/apidocumentation/wp-content/uploads/2025/04/Captura-de-pantalla-2025-11-21-a-las-13.51.29.png[IMG2]
Salaries are not the only factor in compensation. TalentUp also provides information about benefits commonly offered by employers. These are divided into several categories:
- Most common benefits: These include professional development budgets, health insurance, and access to cutting-edge technology. These are frequently offered across companies in the role you are researching.
- Side benefits to attract and retain talent: Examples include work-life balance initiatives, flexible working hours, the ability to work remotely, and being recognized as an equal opportunity employer. These benefits are increasingly important for candidates and play a big role in employer attractiveness.
- Statutory benefits: These are benefits required by law, such as social security contributions, minimum wage compliance, paid time off, sick leave, and pension contributions. While these are mandatory, their value can still be included in the analysis to show the full picture of what employees receive.
This section ensures users do not focus solely on base salaries but consider the broader package that contributes to employee satisfaction.
Step 6: Participants (Benchmarking Companies)
Another feature on the results page is the list of participants. These are companies included in the benchmark for the selected role. Sometimes these are organizations that actively share data, and other times they are companies identified as relevant players in the market for that role.
For instance, the screenshot lists companies like Google as participants. This gives you an idea of which employers are driving the salary levels for the role in the selected location.
Step 7: Feedback and Evaluation
At the bottom right of the page, there is a section where users can rate the page or share feedback. This feature allows TalentUp to improve the quality of its data and the usability of the platform based on user input.
Why Market Salary Search Is Valuable
The Market Salary Search feature is not limited to showing a single salary figure. Instead, it offers a comprehensive overview of:
- The base salary and total compensation package.
- Salary progression across levels of experience.
- Market conditions such as supply and demand.
- Gender representation and possible pay gaps.
- Benefits, both common and statutory, that complement salaries.
- The companies involved in shaping the salary benchmarks.
For professionals, this information is critical to prepare for salary negotiations, assess career prospects, and choose the right employers. For companies, it provides valuable benchmarking to ensure they remain competitive in attracting and retaining talent.